Social’s contribution to revenue is real, but proving it to your finance team isn’t always easy. Five report structures can help: social-assisted conversion, cost per acquisition by channel, social commerce revenue, care deflection savings, and social’s influence on customer lifetime value. Each one is buildable from Emplifi’s Unified Analytics data.
Your quarterly business review is in two weeks. Your CMO has asked you to show social’s contribution to revenue.
You’ve got engagement data. Reach data. Follower growth.
But none of that translates easily to revenue, which makes it hard to justify your team’s hard work.
Luckily, there are five reports you can use to answer that question. Here’s everything you need to know about each one.
In this guide, you’ll learn:
Likes, reach, and impressions measure activity. However, finance needs more than that to justify spend on your social channels.
They need to measure an outcome like:
The five reports below will help you do just that.
This is the report that fixes the last-click problem, and it can be the biggest of the five once it’s built.
Last-click attribution credits a sale to the channel that happened to be clicked right before checkout.
Social usually isn’t that channel. It sits earlier at the discovery or consideration stage, the moment someone first noticed you.
For example, a customer finds you on Instagram. Three weeks later, they click an email and buy. That conversion gets logged as email’s win.
Social did the actual work. It gets zero credit.
This is where your report earns its keep.
Get a demo and we'll walk through what your QBR slide would actually look like.
Executives already understand CPA so no one needs to learn a new metric here.
To present it accurately in a report, use this formula:
Total social spend (content production, tools, and a reasonable headcount allocation, not just paid spend) ÷ conversions attributed to social = CPA by channel
You can use it for organic channels, paid channels, and then split it again by platform to understand exactly how each campaign is performing.
An organic Instagram program and a paid TikTok campaign can produce very different numbers. Averaging them together hides the comparison your CFO might need to see.
If social’s CPA lands below paid search or email, that’s a stronger budget argument than any engagement metric.
Because it’s the same yardstick finance already applies to everything else, it’s easy to compare channel vs channel.
This is one of the easiest reports to pull together, as long as your commerce platform is linked to your social data.
When a customer taps a product tag inside a shoppable post, they can buy without ever landing on your site.
There’s no email capture. No retargeting pixel. No last-click debate to have.
That’s what makes this the cleanest number of the five.
Carhartt shows what this report looks like once it’s built. Using Emplifi UGC, the brand reports a 27% conversion rate from UGC and $150,000 in directly attributed revenue from user-submitted content.
Your human agents are skilled members of your team. Their expertise and experience can be much better spent on complex cases that require the human touch.
Meanwhile, Tier 1 cases, such as tracking enquiries, can be fully resolved by Fuel AI without involving any of your teammates.
Emplifi’s own airline research found AI resolved up to 31% of Facebook DM conversations with no human intervention, and airlines responded up to 21 times faster on Instagram than the average consumer brand.
That’s the volume that makes this report worth building.
Freshpet shows what deflection looks like at brand level. After rolling out Emplifi, the pet food brand routed routine questions to two FAQ chatbots, Scout and Chaser, and cut overall call volume by 40% while improving live-agent response times by 29%.
Do customers who find you through social stick around longer and spend more than customers acquired anywhere else? That’s the question this report answers.
Customer lifetime value (CLV) is the total revenue a customer generates across their whole relationship with your brand. It covers every repeat order, renewal, and upgrade that follows.
If they do spend more with you, that’s social’s contribution continuing well past the first purchase, and it’s a strong closing argument for the budget conversation.
For this report, you’ll need a live CRM integration to get the most accurate results.
Present your reports in this order, to tell your finance team a comprehensive story. It shouldn’t take you longer than 10 minutes:
Social’s contribution to revenue is real. The problem is that engagement metrics weren’t built to prove it.
The five reports we’ve outlined above can help you understand the impact your team has on business revenue:
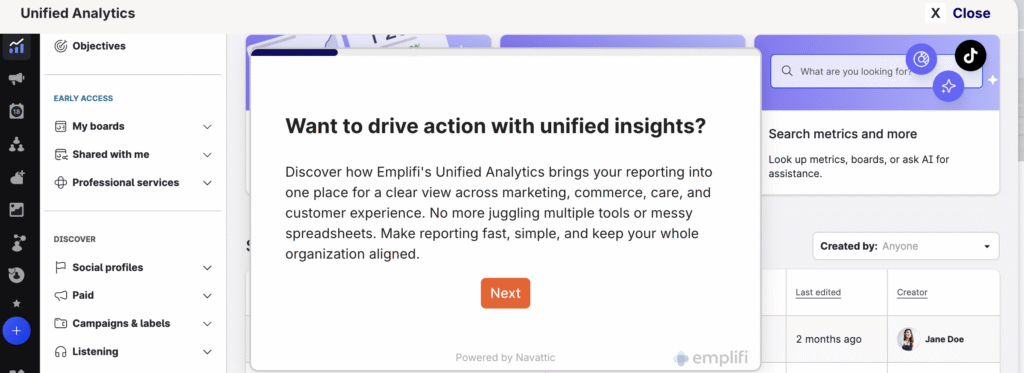
Emplifi Unified Analytics is the starting point for all five reports, bringing social, paid, listening, community, care, and commerce data into one place. For the strategic case behind why this measurement matters in the first place, see our social media ROI guide.
Likes, reach, and impressions measure activity. Finance needs an outcome: a sale, a retained customer, or a support case resolved without an agent spending an hour on the phone. These five reports translate social activity into those outcomes, so your numbers sit in the same language as the rest of the business.
It depends on the report. Emplifi Unified Analytics brings social, commerce, and care touchpoints into one view, which is the raw material for the social-assisted conversion report. Cost per acquisition needs your total social spend, including content production, tools, and a reasonable headcount allocation, plus the conversions attributed to social. Social commerce revenue needs your commerce platform linked to your social data, and customer lifetime value needs your CRM connected so every customer record carries its acquisition channel.
Start with social-assisted revenue, because it’s the largest number and reframes the conversation. Follow with social commerce revenue, then cost per acquisition, then care deflection savings, and close with customer lifetime value. The whole run should fit in about ten minutes.
Multiply your total AI-handled Tier 1 cases by the difference between your average traditional support cost per case and your social care cost per case. Use cost-per-case figures from your own finance team, so the number holds up when someone questions it in the room.
A social-assisted conversion is a purchase, sign-up, or demo request where social was a touchpoint anywhere in the customer’s path, not just the last click. A customer might find you on Instagram, then click an email three weeks later and buy. Last-click attribution gives that sale to email.
Bringing social, commerce, and care data into one unified analytics view lets you count it, and total assisted conversions × average order value gives you social-assisted revenue. It is often the biggest single piece of social’s contribution to revenue.
To show social’s contribution to revenue in CPA terms, divide your total social spend by the conversions attributed to social. Count content production, tools, and a reasonable headcount allocation in that spend, not just paid media. Then split the result by organic versus paid and platform by platform, because averaging channels together hides the comparison your CFO needs. For the wider budget case behind social’s contribution to revenue, see our social media ROI guide.
The report compares social-acquired customers with customers from other channels, so every customer record has to carry its acquisition channel. That data lives in your CRM. Without a live CRM integration, you can’t segment customers by channel or pull average CLV per segment, so flag this dependency before you promise this part of social’s contribution to revenue.