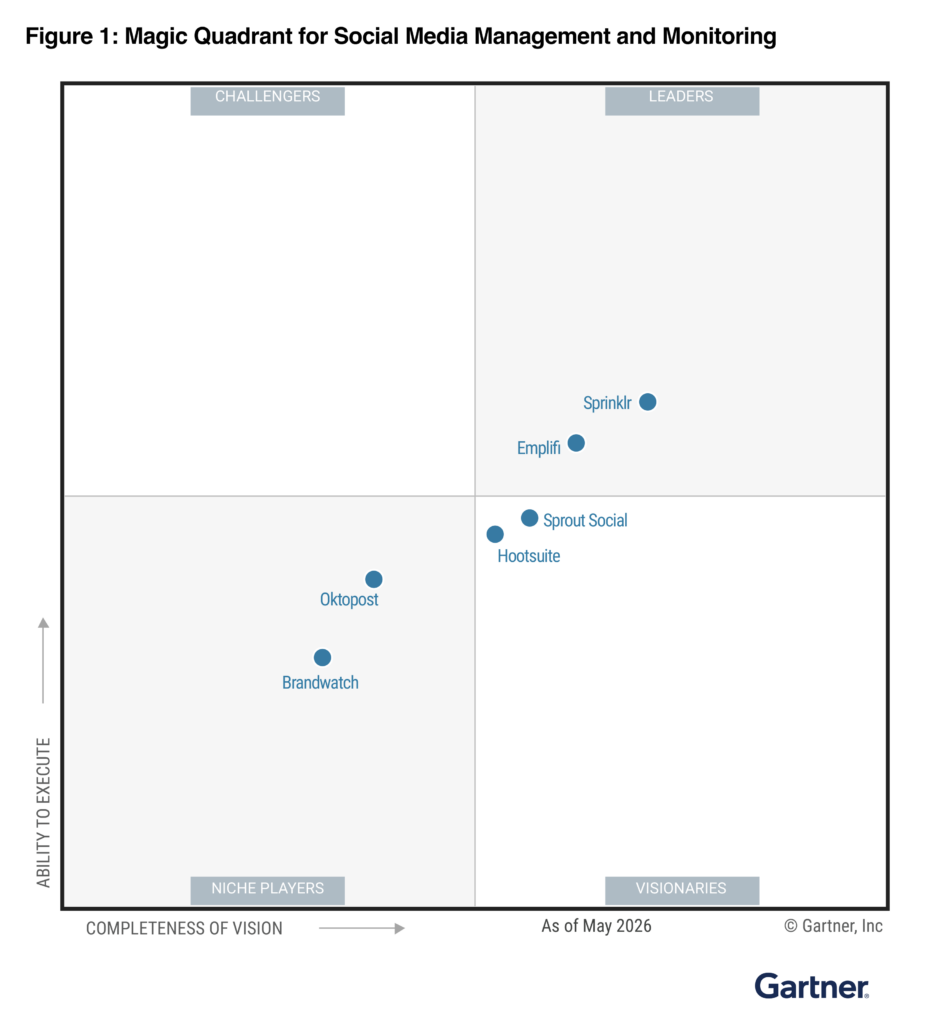
2026 Gartner® Magic Quadrant™

Emplifi named a Leader in the 2026 Gartner® Magic Quadrant™ for Social Media Management and Listening

Get the Report

Emplifi named a Leader in the 2026 Gartner® Magic Quadrant™ for Social Media Management and Listening Get the Report

Blog
15 min read
Oct 02, 2026

Social media metrics for marketers: The ultimate guide

Social media metrics are measurable data points that show how a brand’s social media activity performs. They cover reach, engagement, conversions and ROI, and they tell a team how its audience behaves, which campaigns work and what social contributes to the business.

Molly Pannell  Director of Product Marketing at Emplifi
Social media metrics analysis

Key points

  • Sort your metrics into three groups (awareness, engagement and conversion) and tie each one to a business goal.
  • Calculate engagement against actual reach, then compare it with the median for that platform, because engagement rates differ widely by network.
  • Use UTM parameters, pixels and one consistent attribution model to connect social activity to leads, sales and ROI.
  • Give each role its own dashboard and automate the reporting, so your team spends its hours on analysis instead of spreadsheets.

Median Instagram reach fell by 30% to 40% across carousels, images and Reels in 2025, according to Emplifi’s Social Media Benchmarks 2026, an analysis of more than 200,000 brand profiles. Any team that led its monthly report with reach spent the year explaining a drop it did not cause. The teams that reported shares, clicks, conversions and revenue had a more accurate story to tell.

The numbers you track should connect to a business goal and show what social returns on the budget and hours you put in. Get that right and the data sharpens your social strategy and shows leadership that the work pays off.

The three pillars of social media measurement

A useful measurement plan groups metrics by the question each one answers:

  • Awareness metrics show your brand’s visibility and how far you reach new audiences: reach, impressions, follower growth and share of voice.
  • Engagement metrics measure the quality and depth of your audience’s interactions: comments, shares, saves, replies and direct messages.
  • Conversion metrics capture the actions that move revenue: clicks to your site, sign-ups, purchases and leads.

Each pillar serves a different reader. Your social team lives in engagement, your demand team cares about conversions, and leadership wants to see how the three connect. The connection gets much easier when social data flows into your customer relationship management (CRM) system, because then a comment, a click and a closed deal sit in the same record.

Engagement metrics that drive results

Engagement is the pillar most teams track and the one most teams calculate loosely. A thoughtful comment or a share with a personal note tells you far more than a like, so weight your analysis toward the actions that take effort. Our guide to social media engagement covers how to grow it; this section covers how to measure it.

How to calculate true engagement rate

Many dashboards divide engagements by followers. Followers are a poor denominator, because many of them never see any given post. Use the people who actually saw it instead:

True engagement rate = (Total engagements ÷ Actual reach) × 100

Say a post reaches 40,000 people and earns 1,200 comments, shares, saves and clicks. Its true engagement rate is 3%. Run the same math on every post for a month and you see which formats and topics earn attention from the people who saw them, independent of follower count.

What engagement looks like by platform

There is no single “good” engagement rate, and Emplifi’s own data shows why. In Emplifi’s Social Media Benchmarks 2026, which analyzed brand activity on six networks, the median engagement rate for brands looked like this:

  • TikTok: peaked at 35.9% in Q3 2025 and was 27.6% in Q4 2025, the highest of any major platform.
  • Instagram: fell from 16.9% in Q1 2024 to 9.7% in Q4 2025.
  • Facebook: stayed between 1.4% and 2.4% in every quarter.

These figures are medians: the middle value across brand profiles on each platform, so a handful of viral accounts cannot skew them. Two practical rules follow. Compare a platform’s rate only with that platform’s median, never with another network. And before you compare your own number with any benchmark, check that both use the same formula, because a reach-based rate and a follower-based rate for the same post can sit far apart.

Beyond basic engagement metrics

The most useful engagement signals sit below the headline numbers:

  • Comments and context: Read the conversations behind the count. Comment threads show real sentiment and tell you whether the message landed the way you meant it to.
  • Saves and bookmarks: A save means someone plans to come back. It is one of the clearest signs that a post has lasting value.
  • Shares with commentary: When someone adds their own view before sharing, your message reaches their network with a personal endorsement attached.
  • Direct messages: Private messages often carry the most intent, whether it is a product question, feedback or a step toward a purchase.

Measure paid and organic content separately. Organic posts build the relationship over months, while paid campaigns are bought to produce a result this week. Judge each against its own goal, or the paid numbers will make your organic work look weak and the organic numbers will make your paid spend look wasteful.

Conversion and ROI social media metrics that matter

Most marketers accept that social drives sales and customer growth. Proving it to leadership is harder, and it comes down to linking social performance to the goals the business already tracks.

Direct conversion tracking methods

A conversion is any action you value: a purchase, a sign-up, a download or a webinar registration. Your essential tracking toolkit includes:

  • UTM parameters: Tag every link you post so your web analytics can trace each visit to its platform, campaign and post. A tagged link carries a source tag such as ?utm_source=instagram, plus utm_medium and utm_campaign tags for the channel and campaign. Agree on one naming pattern before launch, because inconsistent tags split your data.
  • Website tracking pixels: These small pieces of code record what visitors do on your site, from page views to completed purchases.
  • Platform conversion tags: Tools such as the Meta Pixel and Google Ads conversion tags show how people who saw or clicked your ads behave afterward, and whether they convert.
  • Event tracking: Measure specific actions on your site, such as adding an item to the cart or completing a form.
  • Custom goals: Define goals for each campaign inside your analytics platform so every report shows progress against the target you set.

Test the setup before a campaign goes live. Click your own tagged links, complete a test conversion and confirm it appears in your analytics with the right source.

Attribution modeling for social media

Few people buy after a single post. A purchase journey usually spans several touchpoints, and attribution models decide how much credit each one gets:

  • First-touch attribution: Gives full credit to the first interaction with your brand, which rewards discovery.
  • Last-touch attribution: Gives full credit to the final interaction before the conversion, which rewards the closing touchpoint.
  • Multi-touch attribution: Spreads credit across every interaction in the journey.

Many social teams use the U-shaped model, a variation of multi-touch. It gives 40% of the credit to the first touch, 40% to the last touch and spreads the remaining 20% across the interactions in between. That split suits social well, since social often starts the journey and then shows up again just before the purchase.

Pick one model and keep it for at least two quarters so your trends stay comparable. If last-touch is your company standard, run a U-shaped view beside it once a quarter. The gap between the two shows how much of the pipeline social starts but rarely gets credit for.

Calculating true social media ROI

To calculate social media ROI, use this formula:

ROI = (Value generated minus investment cost) ÷ investment cost × 100

Count the full investment: ad spend, creator fees, software, agency costs and the team’s hours. Say a campaign costs $12,000 all in and drives $30,000 in attributed revenue. The ROI is 150%. A negative result tells you where to refine before you spend more.

Three supporting metrics make the ROI figure more precise:

  • Return on ad spend (ROAS): Revenue from a campaign divided by its ad spend.
  • Cost per conversion: Total spend divided by the number of purchases, sign-ups or other target actions.
  • Conversion rate: The share of people who complete the target action after they click or interact, as a percentage.

Set your ROAS target from your own margins rather than a borrowed rule of thumb. Your break-even ROAS is one divided by your gross margin, so a business with a 40% margin needs a ROAS of 2.5 just to cover its product costs.

Turning social media metrics into decisions

The brands that get the most from social treat performance data as the brief for the next round of content.

Data-driven content strategies

Let performance data set the content plan. Five steps get you there:

  1. Review the last 12 to 24 months of performance: Find your trends and set your own baselines.
  2. Break down metrics by channel: See what each platform contributes to each goal.
  3. Find your highest-performing content: Look for patterns in topic, format and timing that repeat.
  4. Track revenue impact: Connect content performance to conversions and revenue.
  5. Adjust your content mix: Move effort toward the formats and topics that deliver the most against your goals.

Performance optimization tactics

Put your optimization effort where the data points:

  • Content performance: Video results now differ sharply by network. In Emplifi’s 2026 benchmarks, TikTok’s median video engagement rate rose by about 4% year over year to nearly double Instagram’s, while Instagram video engagement fell by roughly 18% compared with 2024. Budget video by platform, based on how it performs on each.
  • Audience targeting: Social listening shows the conversations and emerging topics your own posts never surface, so your messages match what your audience already talks about.
  • Campaign effectiveness: Link awareness and engagement numbers to sales. When paid, organic and commerce teams look at the same data, they adjust campaigns faster.

Put your social media metrics to work

Discover how teams of all sizes use Emplifi to track, analyze and improve social media performance for stronger engagement and measurable business growth.

Platform-specific measurement strategies

Each network rewards different behavior, so each one needs its own short list of metrics.

Instagram and TikTok metrics

Visual platforms succeed through views, saves and shares. Key metrics to track include:

  • Story engagement patterns: Views, replies and taps forward or back show which Stories hold attention and which ones people skip.
  • Reels performance data: Views, likes, comments, shares and saves show how your short-form video performs. On Instagram, carousels and Reels generated about 44% more median interactions than image posts in Emplifi’s 2026 benchmarks.
  • Shares per reach: Track this one closely on Instagram. Across 2025, shares per reach grew by more than 150% while likes per reach stayed flat, which made shares the platform’s fastest-growing engagement action and its strongest signal for wider distribution.
  • Content save rates: The share of viewers who save a post. A high save rate means the content is useful enough to revisit.
  • Hashtag and search discovery: Measure how much reach comes from hashtags and search compared with your followers, so you know which topics help new people find you.
  • For You traffic on TikTok: The For You feed accounted for more than 70% of TikTok video views by the end of 2025, so measure how each video performs with people who do not follow you yet.
  • Shopping conversion signals: Product tag clicks, site visits from shopping posts and completed purchases show purchase intent.

TikTok is also where brand audiences grow fastest. Median brand follower counts on TikTok rose by more than 200% year over year in the benchmark data, so track follower growth there alongside engagement.

LinkedIn analytics

Professional networks call for business-focused measurement. LinkedIn analytics highlights:

  • Page performance trends: Follower growth, post engagement rates and overall page visibility over time. LinkedIn brand pages posted double-digit median follower gains in the benchmark data, which makes growth a fair metric to report here.
  • Employee advocacy reach: The extra reach and engagement your company content earns when employees share it with their networks.
  • Lead generation: How well your content and campaigns produce qualified leads, including form fill rates and lead quality.
  • Campaign impact: Impressions, click-through rates and conversion rates for paid campaigns.

X analytics

X works best for real-time conversation, and the metrics should reflect that:

  • Top posts: Find your most engaging posts and look for repeatable themes. On X, simple formats lead: GIFs earned a median of seven interactions per post in the 2026 benchmarks, more than twice the engagement of links, videos and images.
  • Followers: Track how your follower count changes over time. Median brand follower growth on X was flat to slightly negative in the benchmark data, so judge X on conversation more than audience size.
  • Volume of mentions: How often people mention your brand shows how much conversation surrounds it, and spikes tell you when to respond.

Facebook analytics

Meta’s own Insights reporting puts paid and organic Facebook data side by side. Key metrics include:

  • Engagement rates: How people interact with posts through reactions, comments, shares and clicks.
  • Page growth patterns: The rate of new page likes or followers over time.
  • Content reach data: How many potential customers your content reaches.
  • Format performance: Live video stands apart on Facebook. It earned a median of 37.5 interactions per post in the 2026 benchmarks, nearly four times the engagement of link posts and more than six times that of image posts.
  • Click performance: How often people click the links in your posts, which shows interest in your offers and off-platform content.
  • Conversion costs: For paid campaigns, the cost per target action, such as a site visit, sign-up or purchase.

YouTube analytics

YouTube channels showed moderate, consistent follower growth in the benchmark data, which fits its role in long-form content and steady audience building. YouTube metrics include:

  • Watch time patterns: The total time viewers spend watching your videos, plus where in each video they drop off.
  • Subscriber velocity: The rate at which your channel gains new subscribers.
  • Audience loyalty: How often viewers come back to watch more, which shows real retention.

Cross-platform and social commerce metrics

A cross-platform view lets you compare performance across networks, spot where each type of content performs best and keep your brand consistent. If you sell through social, add social commerce metrics to that view: checkout starts, conversion rates and average order value show the business impact behind the engagement.

Where AI and automation save time in measurement

AI and automation do three specific jobs in social measurement. Each one removes hours of manual work and leaves the interpretation to your team.

Automated reporting. The Arizona Cardinals used to build weekly reports for more than 350 sponsors by hand, pulling separate analytics from each platform. After automating post labeling and report generation in Emplifi, the team cut manual reporting by 90% and saved more than 500 hours of reporting work, according to the Arizona Cardinals customer story. Emplifi Unified Analytics sends scheduled reports to stakeholders as PDF or XLSX files, so the weekly report arrives without anyone building it.

Live tracking and alerts. With 42 events a year and fighters competing worldwide, UFC’s digital team used to check each fighter’s social stats by hand, hourly. With a fighter leaderboard that shows who is gaining traction, the team spends 95% less time on reporting and analytics, according to the UFC customer story. As UFC Social Media Coordinator Hailey Carroll put it, “What used to take hours is now done in seconds.”

Apply the same idea to your own channels with spike alerts on mention volume and sentiment. A viral post or an emerging complaint then reaches you in minutes, long before next week’s report.

Sentiment at volume. AI classifies the sentiment of thousands of comments and mentions faster than any analyst. Review a sample by hand each month, because sarcasm, slang and in-jokes still trip up the models, and the reason behind a sentiment shift is a judgment call your team makes.

Building a social media dashboard for each role

A single dashboard for everyone ends up serving no one. Build one view per role, each with a short list of metrics and a clear review rhythm.

Social media manager (daily and weekly). This dashboard drives the content calendar:

  • True engagement rate by post and format, compared with the platform median
  • Shares, saves and comments per post
  • Top and bottom five posts of the week
  • Reach from non-followers, such as For You and Explore traffic
  • Alerts for spikes in mentions or negative sentiment

CMO and leadership (monthly and quarterly). This dashboard answers what social returned for the money:

  • Conversions, pipeline and revenue attributed to social
  • ROI, ROAS and cost per conversion by campaign
  • Share of voice against your main competitors
  • Brand sentiment trend
  • One line on what changed and what the team will do next

Customer care lead (real time and weekly). Response speed matters most here. In Emplifi’s survey of 1,650 US and UK consumers, 84% said a quick response time is critical to an authentic service experience, according to Digital authenticity in the age of AI. This dashboard tracks:

  • First response time by channel
  • Inbound volume and open cases by channel
  • Resolution rate and escalations
  • Sentiment of service conversations before and after resolution

Set up monitoring once, then let every dashboard draw on it:

  • Set clear parameters: Define the keywords, mentions and phrases to track.
  • Create alerts: Get notified when volume or sentiment spikes.
  • Design response flows: Decide who handles complaints, questions and compliments, and how fast.
  • Connect every platform: Cover every network where your brand is active, so no conversation falls outside the view.

Your first 30 days of better social measurement

Here is a setup any social team can run in a month, whatever its size:

  • Week 1: Choose three business goals and one metric per pillar for each. Write down the formula for every metric, so this month’s numbers and next quarter’s match.
  • Week 2: Agree on a UTM naming pattern, tag every link, and check that your pixels and conversion tags record a test purchase or sign-up.
  • Week 3: Build the three role dashboards. Set your baselines from the last 90 days and add the platform medians beside them.
  • Week 4: Run one controlled test, such as the same message as a carousel and as a Reel, and compare shares per reach and clicks. Report the result to leadership using the ROI formula.

At the end of the month, you have clean data, a baseline for every goal and one result your leadership can act on.

Frequently asked questions

The most important metrics are the ones tied to your goals, usually reach, true engagement rate, clicks and conversions. Reach shows how many people saw your content, engagement shows how they responded, and conversions such as sales or sign-ups show what social contributed to the business. Track one metric from each of the three pillars to get the full picture.

A KPI is a metric you have chosen as the target for a business goal, so every KPI is a metric while most metrics stay in the background as context. Engagement on a single post is a metric; true engagement rate held above your platform median for a quarter is a KPI. Pick two or three social media KPIs per goal and report the rest as supporting detail.

Reach counts the unique people who saw a post, while impressions count every time it was displayed, including repeat views by the same person. A post seen three times by each of 1,000 people has a reach of 1,000 and 3,000 impressions. Use reach as the denominator for engagement rate, and read impressions as a measure of frequency. Our guide to reach vs. impressions explains both in more detail.

Vanity metrics are numbers that look impressive without connecting to a business goal, such as follower count or total likes viewed on their own. They become useful once you tie them to an outcome, for example follower growth among the audience you sell to. Good social media analytics puts each number next to the goal it serves, so the team sees which ones move results.

Yes. Conversion metrics such as click-through rate, leads and sales link social activity to business outcomes when your links carry UTM tags and your site records conversions. Add a consistent attribution model and the ROI formula, and you can show leadership what each campaign returned and justify next quarter’s budget.

Review post performance weekly and business results monthly, then look at trends and ROI each quarter. Weekly reviews catch underperforming content early, and monthly reviews show whether the trend holds. Daily swings rarely mean much, so save daily checks for alerts on mention spikes and sentiment.

Rank your posts by true engagement rate and conversions, then look for patterns in topic, format and timing among the top performers. Emplifi’s social media marketing platform brings these metrics together across your social channels, with clear views of content performance and audience behavior. Use what you find to plan more of what works, test new formats against your baseline and adjust your posting times.

Insights from Emplifi

Explore our latest blogs and comprehensive guides designed to help you master customer experience strategies and drive growth.

Ready to fuel your teams with A-CX?

Discover what Emplifi can do for you. We turn small teams into large ones, and large teams into well oiled machines, but either way, we offer the rocket ship, you just need to jump on.

What can you expect?

  • A live walkthrough of Emplifi Fuel tailored to your specific social marketing, commerce, and care needs
  • A benchmark of how your brand performs against peers in your industry
  • A partner who understands your business, and 22,000 others
  • A concrete action plan to go from disjointed teams to A-CX
Get a demo