The key to being successful on YouTube is knowing how well your video will do before you upload it. By understanding the subscriber count, watch time, audience reach, retention, click-through rate, and source of traffic, you can ensure that your channel will perform well.
People upload more than 700,000 hours of video per day on YouTube, and only a fraction of those videos are really successful. To learn how to measure YouTube success, you must understand metrics within YouTube Analytics.
In this post, we will analyze six critical YouTube Analytics metrics and what they will add to your channel’s growth.
Let’s get right into it!
What are YouTube Analytics metrics?
YouTube Analytics is a native tool that helps you evaluate and report user behavior with your channel, and its metrics are measurements of individual indicators that make these reports. Social media analytics tools like Socialbakers can help you take your data analysis to another level, but as far as built-in tools go YouTube’s offers a lot of good insights.
When you access YouTube Analytics, it provides you with reports on four key areas: overview, reach, engagement, and audience.
Each report is created using several metrics that YouTube employs. Google regularly updates the core algorithm that forms the basis of these reports because the platform keeps evolving with technology and user feedback.
How to see Analytics on YouTube
YouTube analytics offers you a more in-depth insight into your channel activities, allowing you to optimize your YouTube presence for increased engagement.
Most YouTube influencer marketing techniques revolve around the use of these analytics.
The graphs, numbers, and jargon may make the entire ordeal seem daunting. Still, it is worth your time to actively look at ways to grow and improve your channel’s performance.
To access YouTube Analytics, you must:
Go to YouTube
Click on your profile picture on the top right
Choose ‘Analytics’ on the left sidebar
This is where you will be able to experience the complete range of YouTube statistics.
How to calculate YouTube engagement rate
The engagement tab will give you details about your channel’s interactions with its audience. Some of the core metrics used here include:
Likes/Dislikes
Comments
Shares
Subscribers Change
To calculate a channel’s YouTube engagement rate, add up the total number of likes, dislikes, and comments (in a selected time range) for all the channel’s videos, and divide by the total number of channel subscribers.
6 essential YouTube Analytics metrics
Maximizing consumer engagement is a priority for all businesses, accounts, and channels looking to grow in the digital age.
If you are looking to grow your YouTube channel’s viewer count, these are the six metrics you must keep an eye on:
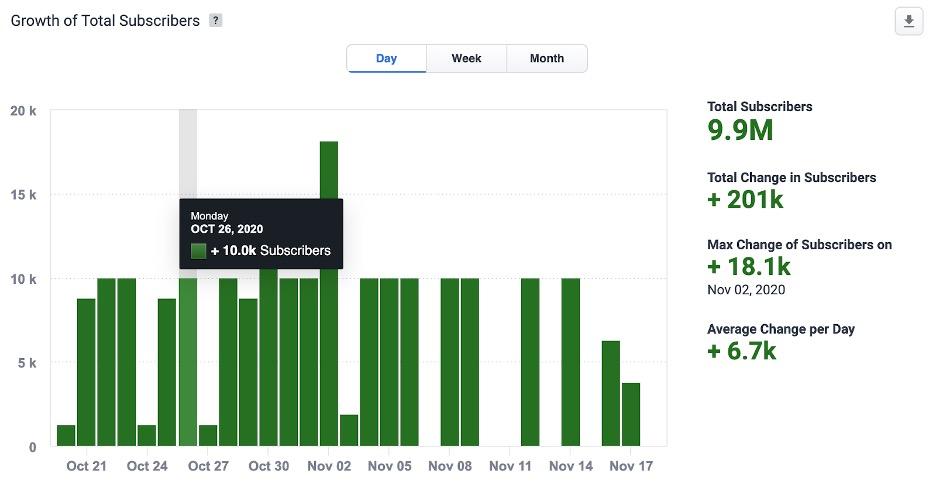
Subscriber count metrics

The difference between an average viewer and a subscriber is that a subscriber gets notified about the updates on your channel, making it easier for them to see and consume your content.
Subscribers are the segment of viewers you depend on for maximum views. The introduction of the bell icon also allows you to send a notification to your subscribers when you post.
The subscribers gained and subscribers lost metrics are self-explanatory. As part of a subscriber report, they can show you the status of your subscribers’ list after every video, allowing you to understand specifically which videos bring in new subscribers.
Watch time metrics

Watch time is one of the main factors YouTube takes into account when suggesting videos to other viewers.
There is a difference between how many views a video gets and the average watch time for a video. It is usual for average content to get views, but it takes high-quality content to engage viewers for an extended amount of time in this digital era.
Estimated minutes watched is a core metric that keeps a record of the average time a viewer watches videos for a specific channel, video, or playlist.
Another core metric that rounds up watch time metrics is average view duration. This measures the average length of video playbacks in seconds.
This metric can help you create high-quality content by showing you at exactly what part of your content a viewer dropped off. Social media video best practices include a focus on the quality of content over quantity.
Audience reach metrics

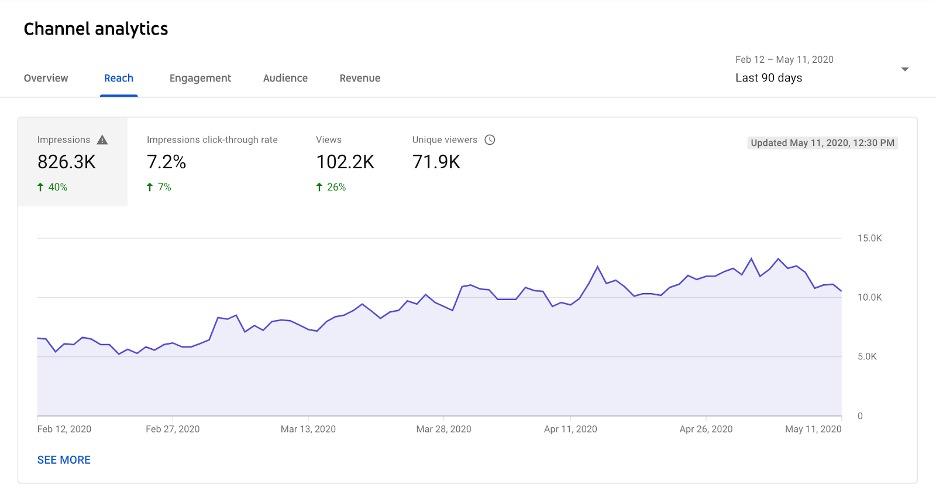
How many unique views did your video receive and how well did it reach your intended audience? Where is your traffic coming from, and what can you do to keep them coming?
Audience reach metrics can help you answer these questions if appropriately analyzed. You cannot discuss the reach without talking about impressions, which refer to any thumbnails, pictures, or text from your channel that shows up on a user’s screen.
Understanding what resonates with users and drives views and clicks is imperative to optimizing your channel presence for better reach.
Audience retention metrics
This metric illustrates how long your video holds a viewer’s attention, measuring viewer drop-off rates for any of your videos.
The audience retention metric will show you the timestamp of the video where viewers began leaving. This will measure your content’s quality and help you improve it by denoting the part of your content that people did not like, or perhaps where it started to get too long for them.
One way to use this information is by adding a CTA right before the average drop-off time to try to gain something from the video, while also factoring in those insights to improve your next video. One of these video editing apps could help improve your videos and get some increased audience retention.
Click-through rate metrics
Impressions click-through rate is another metric that helps you understand your reach. It quantifies how many of your impressions led to views.
There’s also a card click-through rate. Cards are customizable panels placed in a video; these will pop up at certain times, prompting viewers to interact with more of your content. Card click-through rate will show you which cards people are clicking on and the rate of interaction.
A high impressions click-through rate means that your video’s topic, thumbnail, and theme were well received by users and attracted their attention. A high card click-through rate will illustrate what card – and its subsequent content – people liked over another.
Understanding impressions' click-through rates will help you understand what makes you stand out. Use these insights to optimize your marketing collateral, revamp your channel’s logos, color themes, and text according to what the viewers like.
Source of traffic metrics

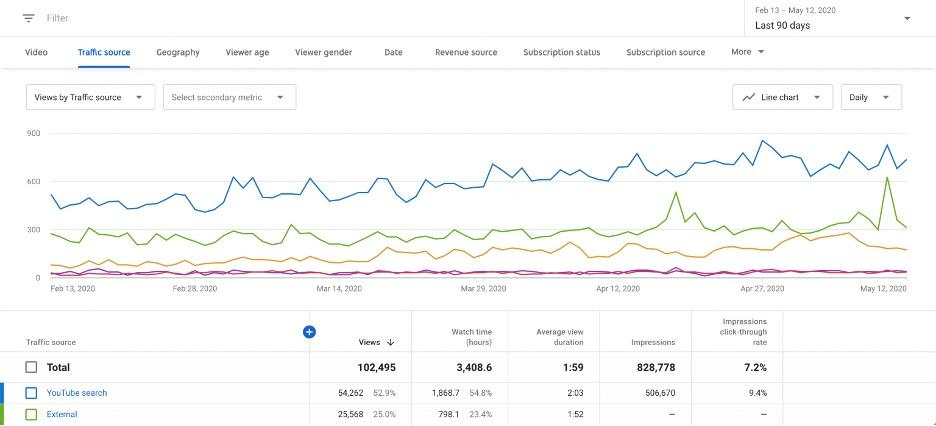
The traffic source metric shows you where your traffic is coming from. It provides in-depth information on the various avenues your viewers take to get your videos.
This metric provides information on the following sources:
YouTube search: Traffic using specific terms and keywords on YouTube to get to your content.
External sources: Traffic from social media platforms and websites where your links have been embedded. Make sure you're using the right tools for blogging so that your audience can easily consume what you're trying to convey.
Channel pages: Traffic received on videos selected from your main channel page.
Browse pages: Traffic received from the subscription feed or the YouTube homepage.
Suggested videos: Traffic received from further suggestions, suggestions at the end of a video, or cards.
Utilize this metric by finding the most efficient source for your traffic and then optimizing its use. YouTube influencers often optimize their source of traffic by linking their YouTube channel to a social media channel.
The takeaway
As far as native social media analytics tools go, YouTube Analytics is arguably the most in-depth and comprehensive option, allowing YouTube to provide the most profound insights for content creators to tweak their strategy. Understanding the social media metrics and how they work is a complicated process but necessary to help your channel grow faster.
And while YouTube Analytics are great, utilizing a tool like Socialbakers (now Emplifi) allows you to do things like easily combine your YouTube metrics in one dashboard to compare and contrast performance across platforms. If you’re interested in learning more, contact us today.
Editor's Note: This article was originally published on socialbakers.com. Any statistics or statements included in this article were current at the time of original publication.


