Editor's note: Mentions of Socialbakers data below reference findings from a Q3 2020 Social Media Trends report. You can view the latest paid and organic social media benchmarks here. Socialbakers is now Emplifi Social Marketing Cloud.
Digital marketing always required extreme agility and hawk-eyed ability to spot trends first and adapt to changing audience behaviors, but the degree to which marketers needed to test this skill set in 2020 was challenging even to the most experienced marketers.
The year transformed many parts of businesses even in those organizations that were resistant to change in the previous decade as the world was turning digital. Now, nearly everyone has adapted.
While we sense that marketing is different this year, nothing can illustrate just how drastically it changed like data can. Here we’ve collected 21 social media data points that show the crucial role social media and digital marketing played in 2020, and how it will change in 2021 and beyond.
These 21 stats should give you a sense of what awaits marketers in the next year, but if you want to get more granular information and understand what trends will be shaping your specific sector, go to Emplifi's industry reports to find one for your region or industry.
Social Media Stats
For top brands, Instagram audience is 35% larger than Facebook
Influencer marketing stalled after March, but still grew YoY
Platform Stats
Pinterest is secretly the fastest growing platform in revenue
Facebook, Twitter, and Pinterest all adding new active users
27.7 million viewers attended Travis Scott’s Fortnite concert
Predictions
Users expect to interact with AR on social media more in 2021
Digital customer service interactions will increase 40% in 2021
Google estimates that 60% of programmatic ads will vanish in 2021
2021 predicted average time spent on mobile devices: 4 hours, 6 minutes
Social media ad spend leaps nearly 30%
As the events of 2020 unfolded, there was serious doubt even among the optimists whether businesses would continue spending their money on any advertising at all this year. The Socialbakers data that contrasts 2020 ad spend to 2019 lays the worry to rest.
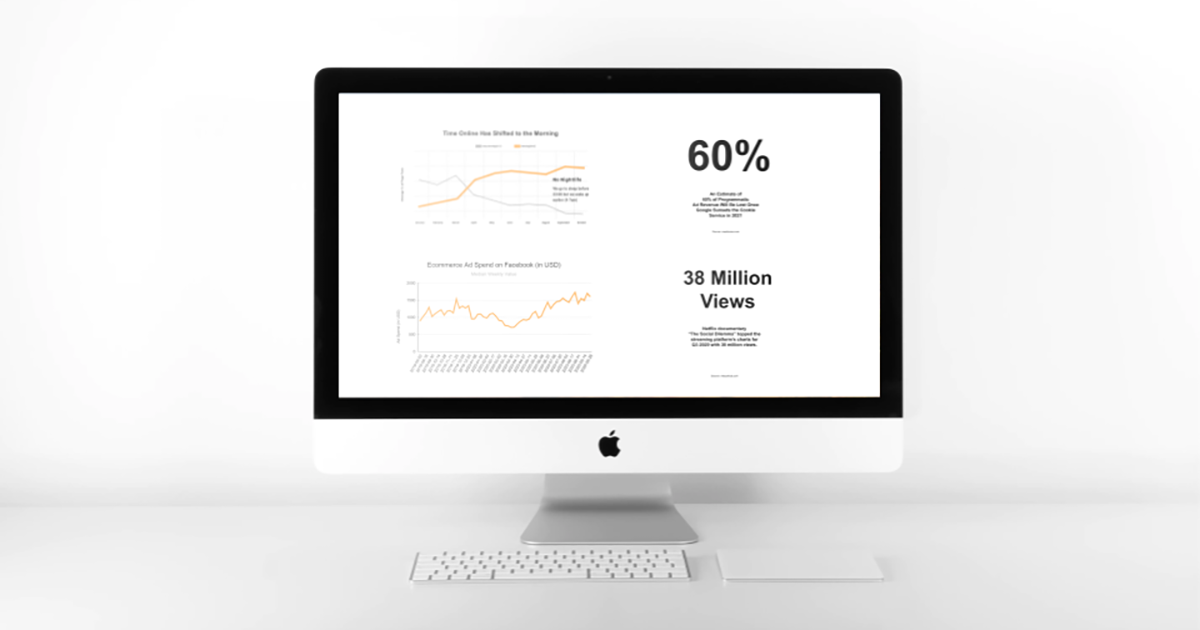
Ad spend on Facebook in Q3 2020 grew 27.6% compared to Q3 2019. This signals that while budgets may have tightened, a lot more was shifted to digital channels. That’s a trend we will continue to see in 2021.
Time spent on social media in early hours doubles
Our behaviors, habits, and routines were shaken up in 2020, which created new habits that are likely to continue to 2021. One of them, data shows, is checking your social media earlier. According to Socialbakers data, 5 a.m. usage of Facebook grew by 98% from Q2 to Q3 2020. This may have an impact on times to post on social networks.
Ads reach expands 135% in North America YoY
One of the concerns about Facebook has been its slowing user growth in North America. However, what the skeptics don’t take into consideration is that for Facebook to continue growing its revenue in North America, it’s not necessarily more users it needs, but rather more ads reach.
According to Socialbakers data, in Q3 2020 this particular metric grew a staggering 134.9% YoY.
Average business reply on Facebook: 1 hour, 56 minutes
This is how long, on average, it takes businesses to get back to customers on Facebook, yet for 50% of consumers the expectation is to get an answer within 30 minutes. According to the same 2020 Eptica Digital Customer Experience Study, on Twitter, 50% of consumers have the same 30 minute response time expectations, while the average response time nearly meets expectations at 33 minutes.
For top brands, Instagram audience is 35% larger than Facebook
2020 was the year we finally saw Instagram pull away from Facebook in this metric. According to Socialbakers data, for the top 50 largest brands on Instagram and Facebook, their audiences are 35% larger on their Instagram profiles.
Influencer marketing stalled after March, but still grew YoY
It’s been a tough year for influencers. Travelling restrictions and worldwide lockdowns stalled the influencer economy.
However, overall influencer marketing is still in an uptrend largely driven by micro-influencer campaigns. According to Socialbakers data, the number of influencers who used #ad in their posts increased by 10.6% in Q3 2020 compared to Q3 2019.
Facebook revenue at an all-time high
As marketing budgets shift to social media, it’s inevitable that Facebook will take a share of budgets from digital advertisers. Its Q3 2020 quarterly earnings revealed that even during the most tumultuous period, Facebook’s revenue grew 22% YoY.
Ecommerce spending on Facebook grows 57%
The sector that thrived this year was ecommerce. Socialbakers data shows that ecommerce advertisers spent 56.5% more in Q3 2020 compared to Q3 2019, a trend that’s likely to continue into 2021.
Pinterest is secretly the fastest growing platform in revenue
While attention is often placed on Facebook and Google, the platform that has been around us since 2009, Pinterest, rarely gets visibility. But it should, especially when you look at the platform’s revenue in Q3 2020, which grew 58% YoY.
Another honorary mention in this regard is Snap, growing by 52% in Q3 2020 YoY.
Facebook, Twitter, and Pinterest all adding new active users
While the number of users added to the three platforms grew, there were some concerns over slowing growth on Twitter and Facebook after the platform Q3 earning figures. However, not to be ignored is the fact that there’s still outstanding growth across the board and especially in emerging markets.
TikTok had over 100 million downloads in one month
Where do 115.2 million downloads in March 2020 place TikTok? In a league of its own as the most downloaded non-game app worldwide.
By comparison, as reported by Mediakix, Instagram averaged 111.5 million downloads per quarter. 2020 was the year when both users and brands flocked to TikTok – we’ll likely see this trend continue in 2021.
38 million users see the “The Social Dilemma” documentary
2020 was a turbulent time for the social platforms as well. Arguably, it was the first time that the mass consumer was thrown deep into the operational aspects of the digital economy.
Reflecting this, the Netflix documentary “The Social Dilemma” topped its charts for Q3 2020 with 38 million views. More than likely, in 2021 we will see further developments in consumer education in this regard, and platform’s will be expected to create further transparency.
Total time watched on Twitch in Q3 2020: 4.74 billion hours
How large is that number? According to Streamlabs, on Youtube Gaming Live the number of hours of streaming watched in Q3 2020 was 1.68 billion and on Facebook Live it was 1.04 billion hours. That leaves Twitch with a dominant 63.6% share of watch time, Youtube Gaming Live with 22.5%, and Facebook Live with 14%.
27.7 million viewers attended Travis Scott’s Fortnite concert
In 2020 we saw a glimpse of what digital experiences may look like in the future. While 2021 may not be the year when experiences like Travis Scott’s online concert, co-created with Fortnite, become commonplace, we’ll certainly see event creators, artists, and businesses experiment with new content experiences online in aims to capture the enormous digital audiences.
US retail social commerce expected to grow 35% in 2021
A key variable driving the surge in ecommerce spending has been the innovation that platforms made to help brand overcome social commerce challenges this year. Emarketer is predicting a further 34.8% growth in social commerce next year.
Marketers will prioritize CX for the next 5 years
A survey by SuperOffice revealed that 45.9% of businesses are prioritizing customer experiences over product (33.6%) or even pricing (20.5%).
Users expect to interact with AR on social media more in 2021
In 2020, according to eMarketer, 30% of people interacted with augmented reality (AR) social media content on a monthly basis. In 2021, that number is expected to grow by a further 7.2%, reaching a total of 46.9 millions users. Is your brand ready for this 2021 content trend?
Digital customer service interactions will increase 40% in 2021
Many business sectors were forced to digitally transform during 2020. While there are still many hurdles to overcome, the rewards of this transformation will come into play in 2021, but also it will require businesses to bolster their digital marketing and customer service infrastructure.
A report by Forrester projects that digital customer service interactions will increase by 40% in 2021. It also predicts that the average number of digital brand channels will grow from 8 to 11.
Podcast ad spending to hit $1 billion in 2021
As projected by eMarketer, the US ad spend on podcasts will grow 44.9% over the course of 2021. Interestingly enough, still only about 4% of podcast advertising is programmatic.
Google estimates that 60% of programmatic ads will vanish in 2021
The reason? Google promised to sunset the cookie before 2021, and now that’s more likely to happen sometime in early 2021. As a result, tracking users across web properties will become near impossible – meaning first-party data will be key for any marketer to reach and analyze their audiences.
2021 predicted average time spent on mobile devices exceeding 4 hours
Emarketer estimates that while the growth of time spent on mobile is flattening, in 2021 it will rise by 5 minutes compared to 2020. However, the most impressive jump happened in 2020, when we spent 26 more minutes on our mobile devices compared to 2019.
Editor's Note: This article was originally published on socialbakers.com. Any statistics or statements included in this article were current at the time of original publication.


