Emplifi named a leader in The Forrester Wave Social Suites. Access the report.

Emplifi Social Media Benchmarks 2024

Jeff Haws — Director of Content Marketing, Emplifi

The social media benchmarks to guide your 2024 strategy

As your social marketing strategy hits its stride in 2024, it’s important to be aware of the recent trends on each social channel so you can know what to measure your results against. Just knowing your own numbers often isn’t enough; you want to know what to expect from brands across the board so you know where you stack up, and where to prioritize your social media management efforts.

We dug into our exclusive data to deliver real-world data that can help you better understand the social media landscape heading into this new year. In addition to highlighting the data we were able to put together, we’re offering our own expert insights into what these numbers mean for social media marketing teams, along with offering strategic advice for your brand based on what we learned for both organic and paid social media. 

Here are some of the most prominent, high-level metrics we thought were worth highlighting for your team. If you want to dig further into these benchmarks, be sure to download our 2024 Social Media Benchmarks report today!

Editor's Note: As our analysis includes periods before Twitter’s re-brand to X, charts will
reference the name “Twitter” only.

Table of Contents

Organic social media benchmarks

Paid social media benchmarks

Takeaways


Organic social media benchmarks

This is where most social media marketers focus their time, so we wanted to start here. We’re looking at social media engagement by channel and post type to give you a deep look at how the median brand we work with has seen social media performing in recent quarters.

Engagement trends (Median interactions/1K impressions, including Paid)

1. Instagram is seeing improved engagement

Instagram enjoyed its best numbers in more than two years, improving 9% from Q3 2023 as the only channel that saw any meaningful shift in the final quarter of 2023. This positive shift highlights its enduring appeal and suggests that the platform continues to be popular with a wide variety of users.

Advice: Capitalize on Instagram's improved engagement by prioritizing the platform in your social media strategy. Invest in creative and engaging content tailored to Instagram's audience, emphasizing visually-appealing and interactive elements.

2. Engagement on TikTok has seen a decrease since the start of 2022

TikTok’s engagement numbers remain strong, particularly compared to Facebook and X (formerly Twitter). However, post interactions per 1K impressions are down 26% from its highest numbers at the start of 2022. At that time, Instagram and TikTok’s engagement rates were nearly even, but now, Instagram’s is 52% higher.

Advice

  • Evaluate and adapt TikTok strategies to reverse the decline in engagement. Consider analyzing trending content and exploring collaborations with influencers to re-ignite interest. Stay agile in response to evolving trends on the platform.

  • While maintaining a presence on TikTok, focus on leveraging Instagram's dominant position by allocating resources and creative efforts to the platform. Tailor content to align with Instagram's visual-centric and interactive nature.

3. Facebook and X/Twitter have seen little change since Q1 2022

Facebook and X/Twitter have shown remarkable stability in engagement in recent quarters. This can be seen as positive, but it also indicates the need for marketing teams to explore innovative strategies to reinvigorate user engagement on these platforms.

Advice: Experiment with new content formats, interactive features, and storytelling narratives on Facebook and X/Twitter. Monitor user feedback and adjust strategies to align with changing audience preferences.


Engagement by post type (median brand interactions)

1. Reels and Carousels are excelling on Instagram

Reels and Carousels on Instagram are the standout performers, seeing 65 median post interactions in 2023. Although, engagement rates are down somewhat across the board on the channel, with median interactions down from 25-45% for all post types.

Advice: While Reels and Carousels remain effective, marketing teams should closely monitor performance metrics and adjust content strategies on Instagram. Experiment with fresh and engaging content ideas to counteract the overall decline in engagement.

2. Live video is the runaway engagement winner on Facebook

Live video on Facebook is absolutely dominant right now, seeing about 3x more median post interactions than the next post type (Carousel). This indicates a strong preference among users for real-time and interactive content on the platform.

Advice: Prioritize live video content on Facebook to leverage its exceptional engagement rates. Plan and schedule live sessions, Q&A sessions, and behind-the-scenes content to keep the audience engaged and foster real-time interactions.

3. GIFs are performing best on X/Twitter, but are seeing declining engagement

While GIFs outperformed other post types on X in 2023, it’s important to acknowledge that median post interactions for GIFs are down 36% since Q1 2022 — a decrease that is fairly uniform across the board for other X/Twitter post types, too.

Advice: While continuing to use GIFs on Twitter, marketing teams should ensure their content strategy on the platform is diversified. Experiment with video content, polls, and threaded Tweets to counteract the decline in GIF interactions and keep Twitter content engaging.


Video engagement on TikTok and Instagram

As the most prominent visual- and audio-centric social networks, TikTok and Instagram regularly draw comparisons. Here are social media benchmarks based on our analysis of over 1,000 sister Instagram and TikTok brand profiles. 

1. Median page interactions and median video views decreased on Instagram and TikTok from 2022 to 2023

Q4 2023 saw Instagram with the lowest median brand interactions in the time frame included in our analysis, dropping by nearly half since Q1 2022. In the same time period, TikTok’s interactions dropped by 39% as well, though the drop has only been 9% since Q3 2022. 

The story is similar when it comes to median video views, with Instagram’s numbers having decreased 49% since Q1 2022, while TikTok has fallen 26%, with the bulk of that happening before Q3 2022.

Advice 

  • Recognize TikTok's stability and consider it a valuable platform for maintaining brand engagement. Refine your TikTok content strategy by staying attuned to trending challenges, leveraging creative audio and visual elements, and maintaining a consistent posting schedule.

  • Marketing teams should conduct a comprehensive analysis of their Instagram strategy. Reevaluate content quality, relevance, and frequency. Experiment with different content formats, storytelling techniques, and interactive features to revitalize engagement.

2. Despite these decreases, brands remain resilient in posting video on both platforms

Whatever engagement challenges exist, video posting has remained strong on both platforms. Median Instagram Reels posts have nearly tripled since Q1 2022, rising modestly — but consistently — throughout 2023. 

TikTok continued to hold a bit of an advantage here, nearly doubling median posts since Q1 2022, likewise climbing just a bit each quarter of the year.

Advice: Continue prioritizing video content creation on both Instagram and TikTok. Leverage the strengths of each platform's video features, such as Reels on Instagram and the short-form video format on TikTok. Experiment with diverse video content to maintain audience interest.


Paid social media benchmarks

Whenever you’re spending budget on marketing tactics, it’s important to know if you’re getting it right. The channel-specific numbers here should help you to glean real-world insights that will allow you to measure ad performance confidently.

Performance of ads across Facebook and Instagram 

Facebook CPC, CPM, and CTR

For the second straight quarter, Facebook CPC stayed quite low on Stories (down 20% from Q2 2023) but remained relatively steady elsewhere. The stability and decrease in Facebook CPC on Stories suggests that it remains a cost-effective advertising option for marketers. This could be attributed to users' engagement with Stories and the potential for efficient click-through rates.

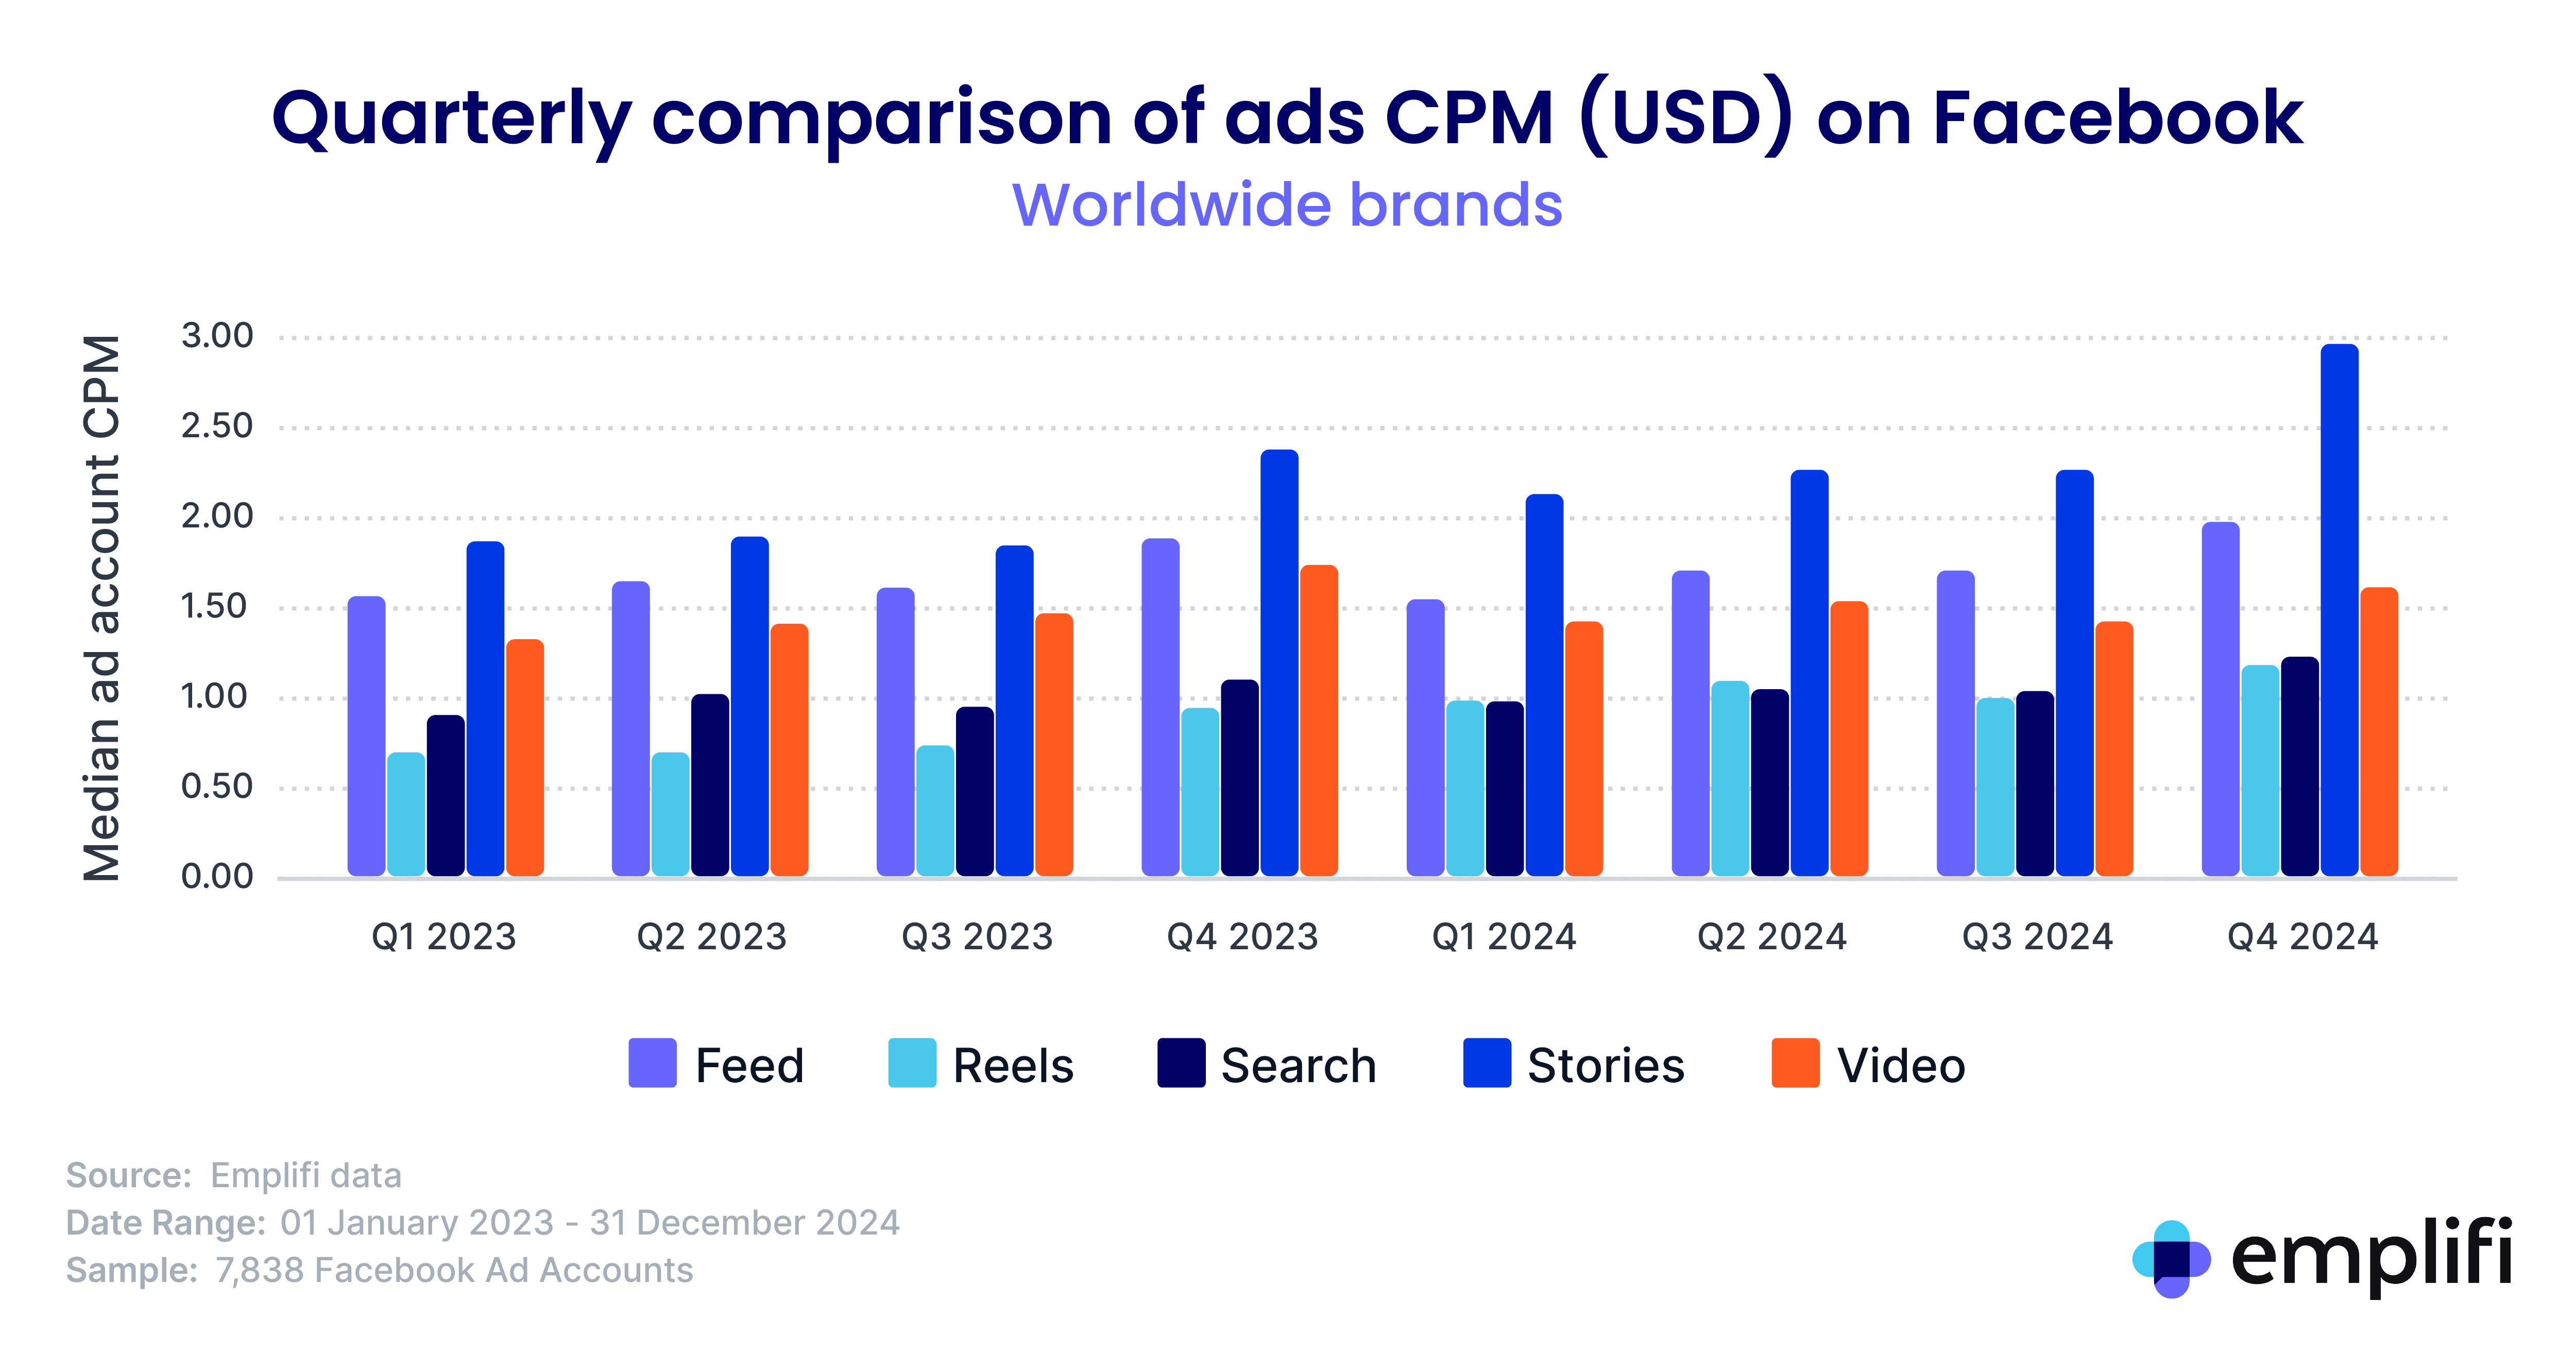
Meanwhile, CPM costs for Stories took a significant jump (29% up from Q3 2023), while the main feed (up 17%) and video (up 18%) also climbed. These increases indicate heightened competition for ad space, which may be due to increased demand or changes in the platform's algorithm.

Other than a 32% jump on Stories, CTR stayed mostly the same across all ad types.

Advice

  • Capitalize on the lower CPC in Stories by crafting compelling and engaging ad content. Experiment with different creative approaches to maximize user interaction and drive conversions.

  • Marketers should carefully evaluate their budget allocation and advertising strategies. While Stories may offer lower CPC, the substantial increase in CPM calls for a strategic balance in choosing placements to optimize cost-effectiveness.

  • Capitalize on the increased CTR in Facebook Stories by fine-tuning ad content to align with user preferences in this format. Experiment with storytelling, interactive elements, and compelling visuals to further enhance engagement.

Instagram CPC, CPM, and CTR

For CPC on Instagram, the main feed had the highest costs for the second straight quarter, and everything was largely unchanged across the board at the end of the year. This could be influenced by users' engagement patterns and the perceived value of ads in the main feed.

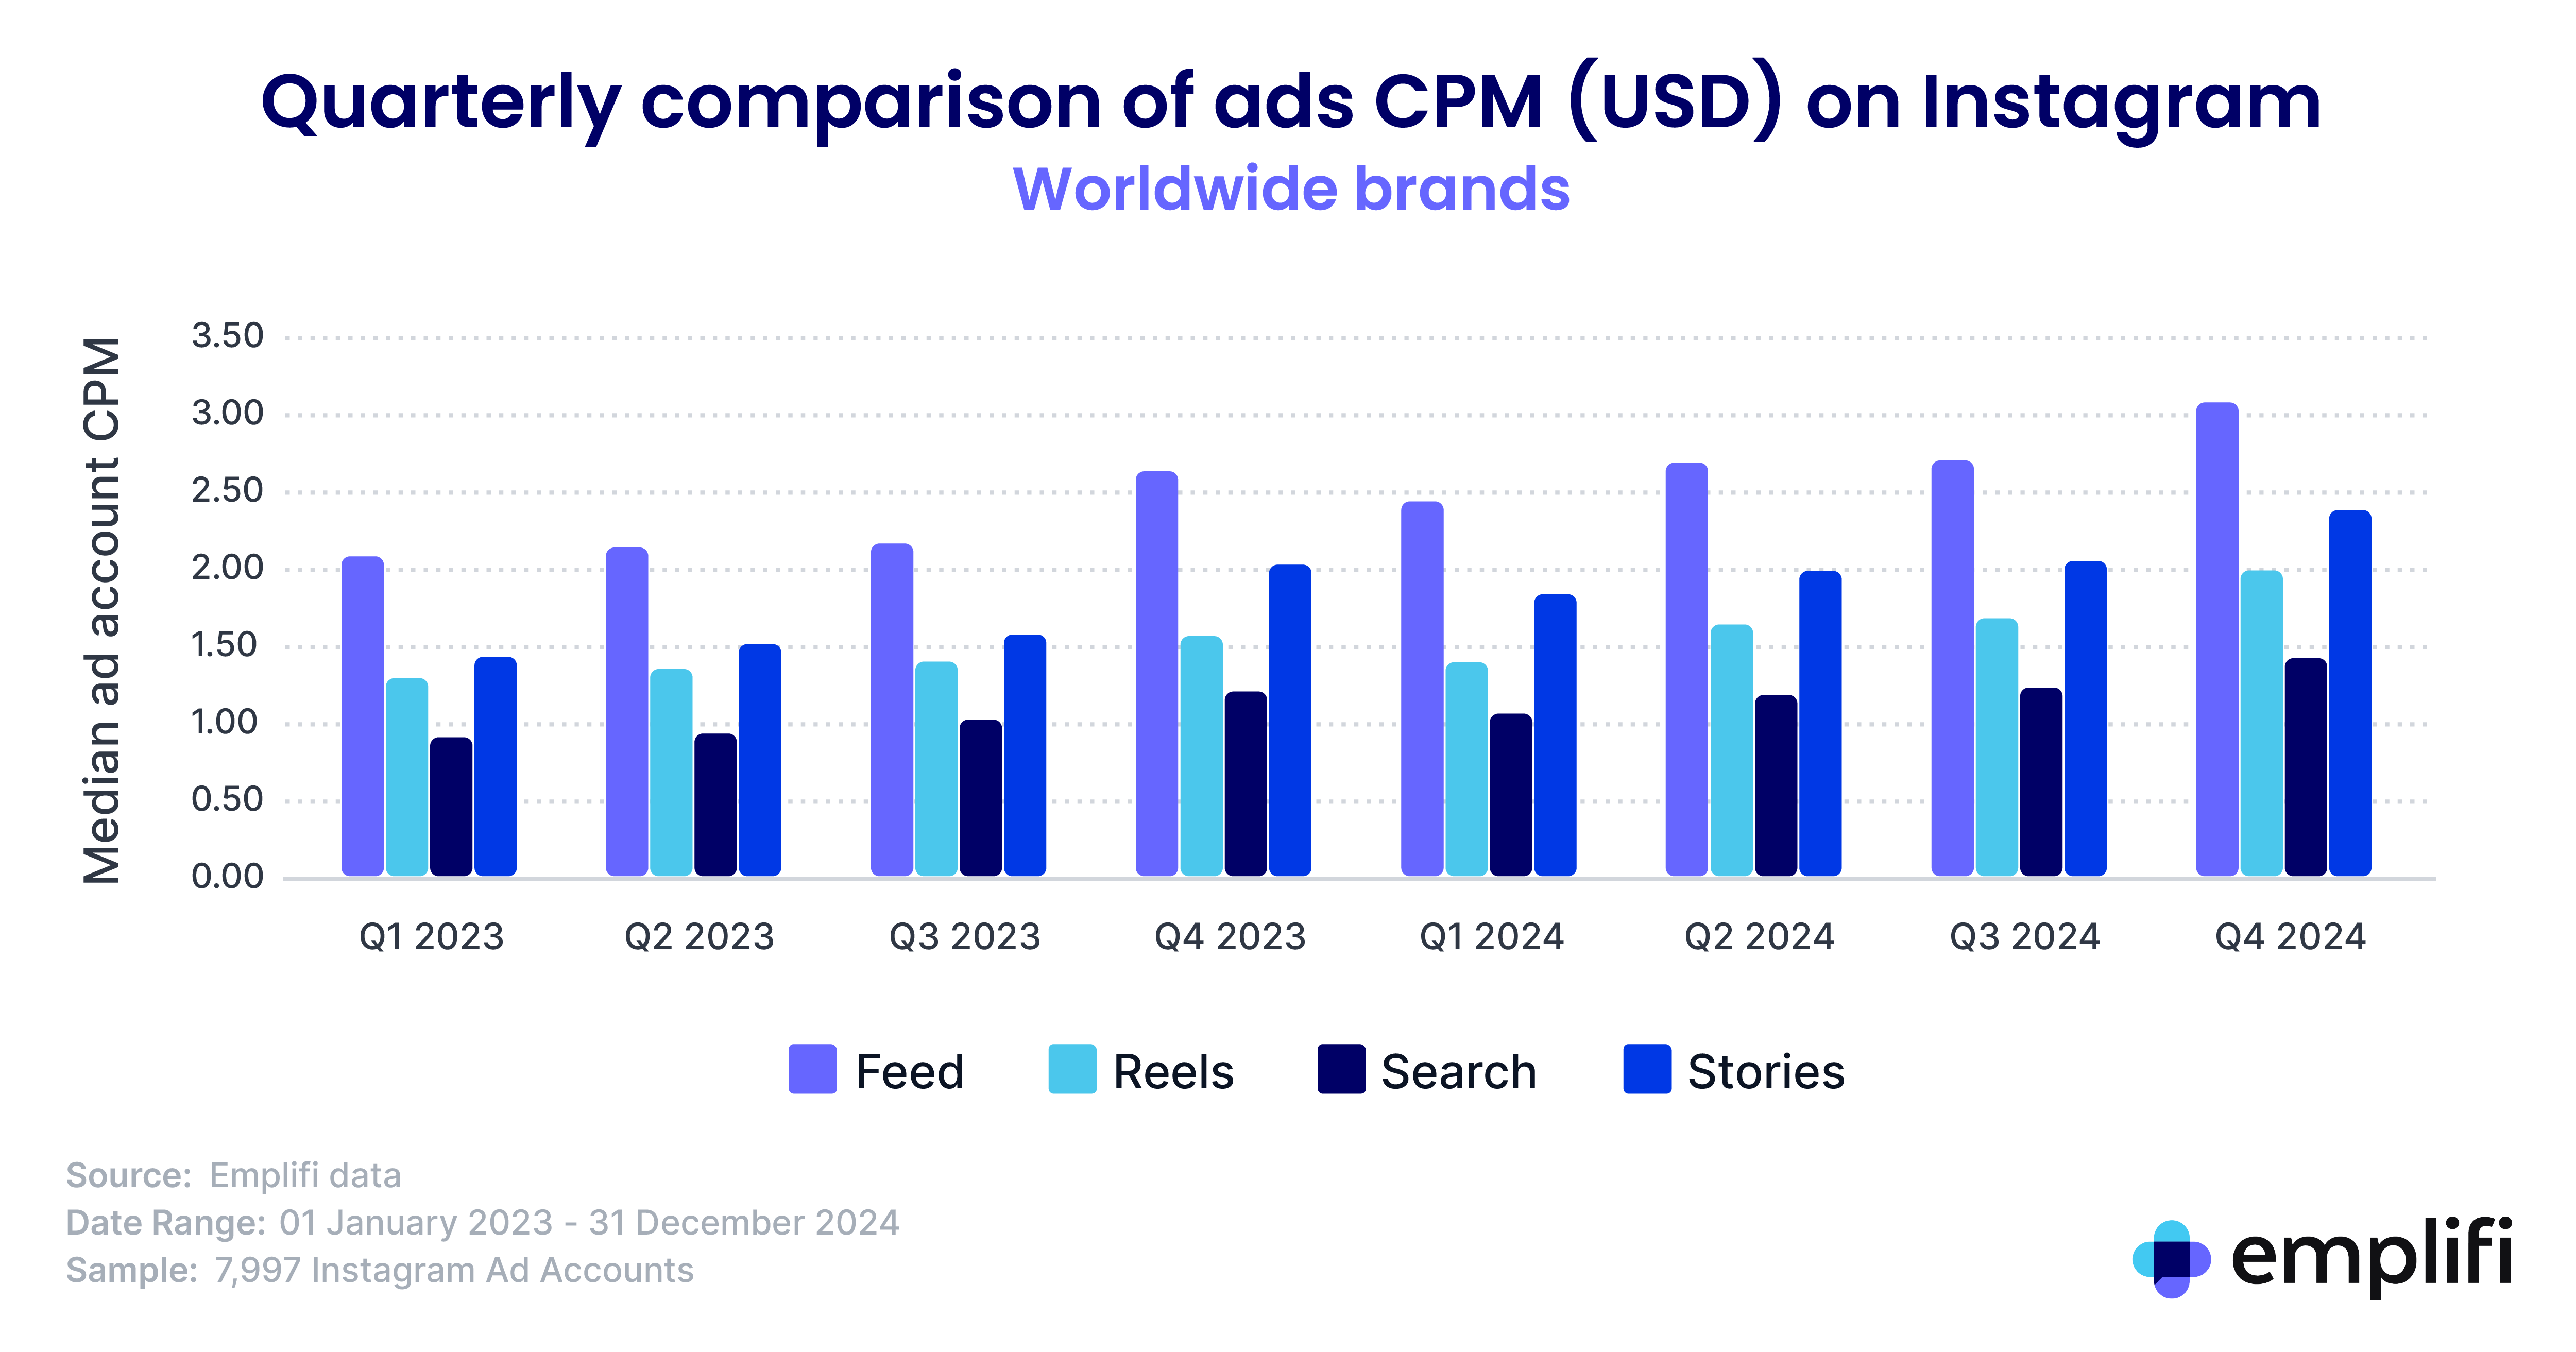
For CPM, though, big jumps in Stories (28%) and the main feed (21%) were the headlines. These increases suggest increased competition and demand for these ad spaces, which could be due to the popularity and effectiveness of visual storytelling formats.

There were more major increases in CTR, though, with Stories up 24% and the main feed jumping 25%, highlighting the effectiveness of visual content on the platform. Users are actively interacting with ads in these formats, presenting a positive trend for marketers.

Advice

  • Marketers should be mindful of budget allocation when planning Instagram campaigns. While the main feed might have higher costs, its potential reach and engagement may justify the investment for certain campaigns targeting a broad audience.

  • Social media marketing teams should reassess their Instagram advertising strategy and ensure they are diversifying content types and testing different ad formats to maintain cost-effectiveness while maximizing reach and engagement.

  • Prioritize investment in Instagram Stories and the main feed for campaigns aiming for high user engagement. Craft visually appealing and interactive content to take full advantage of the heightened CTR in these placements.


Ad performance by channel

CPC by channel

Facebook and Instagram stayed largely steady across 2023, though X/Twitter saw a 26% mid-year drop, reaching a level less than half of what it was in Q2 2022, and showcasing a potential cost-saving opportunity for advertisers on that platform. 

Across Facebook, Instagram, and X/Twitter, the CPC remained fairly stable from Q3 2023 to Q4 2023. 

Advice: Marketing teams should assess their budget allocation across platforms based on CPC trends. If targeting audiences align with X/Twitter, consider capitalizing on the lower CPC compared to previous periods.

CPM by channel

With regard to CPM in Q4 2023, X/Twitter maintained its 41% drop from Q3, while Facebook (17%) and Instagram (19%) both saw notable jumps in the final quarter. X/Twitter settling in at this lower rate, while the Facebook and Instagram surge suggests a potential increase in competition or changes in ad demand on these platforms.

Advice: Marketing teams should review and potentially adjust their budget distribution in response to the changing CPM landscape. Monitor campaign performance closely, considering the cost implications of each platform for effective budget optimization.

CTR by channel

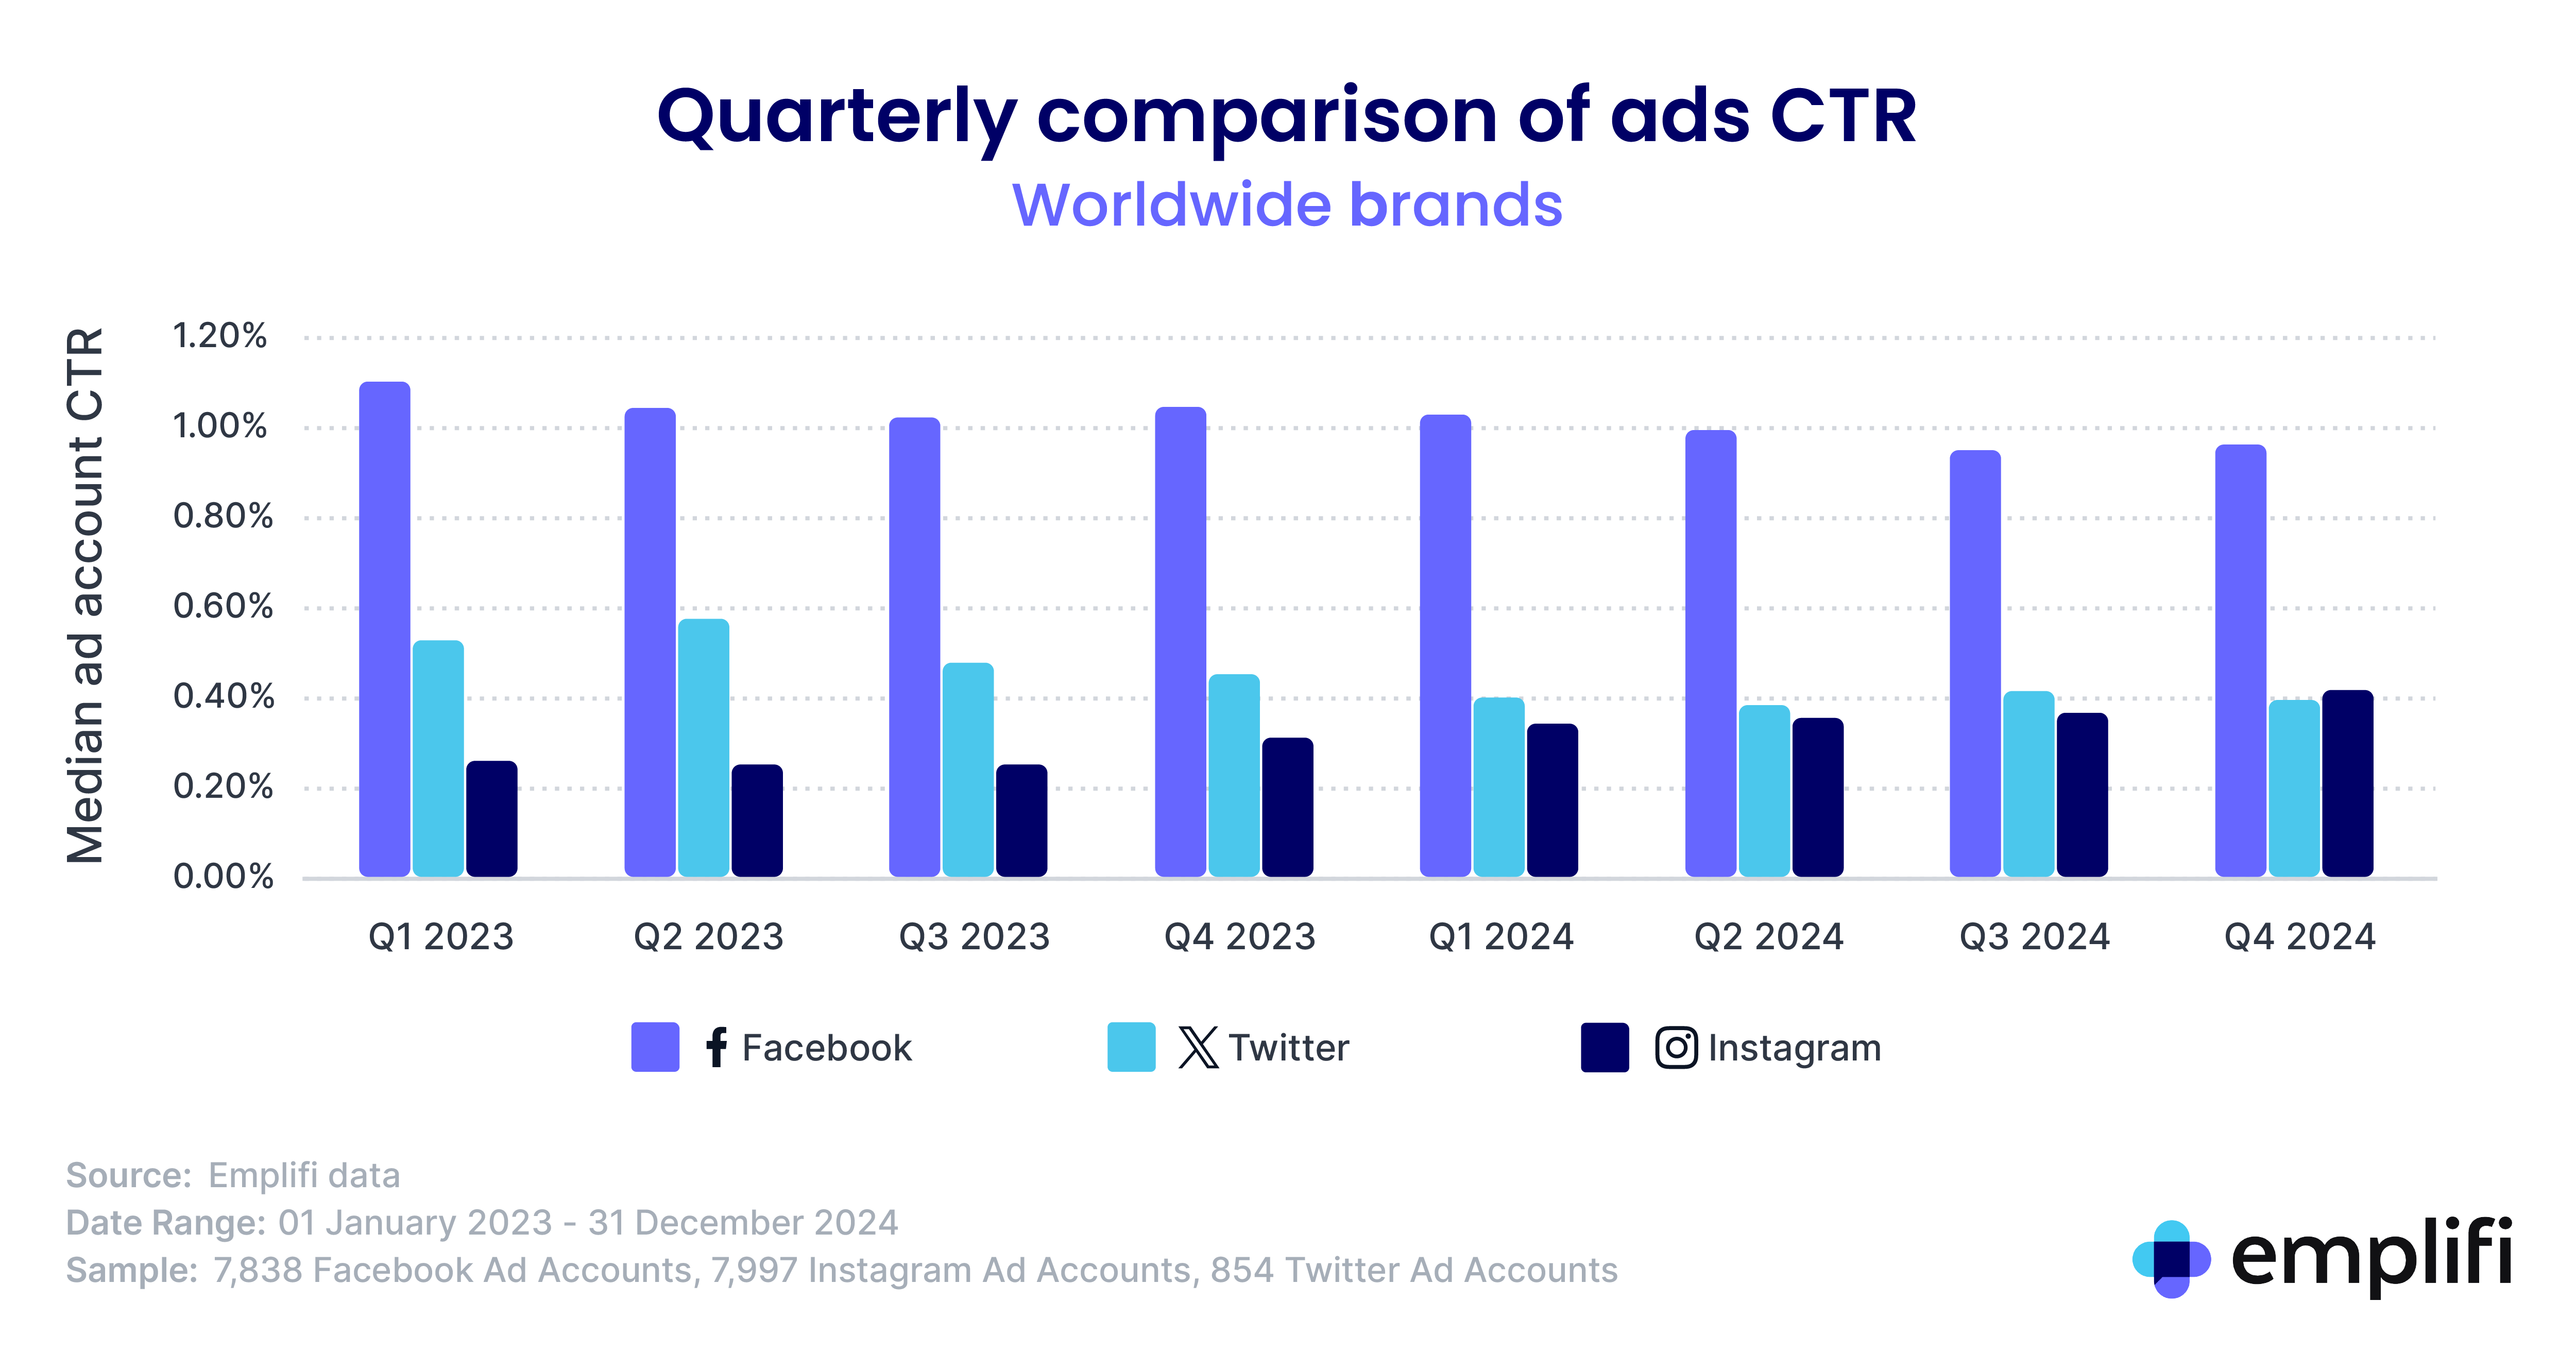
The CTRs saw little change in Q4 2023, mostly holding ground across the board. X/Twitter’s CTR sits 32% down from where it stood in Q1 2022, while Facebook’s is down 20% in the same time period. Instagram, meanwhile, has climbed 25% since then.

Twitter and Facebook’s drops over the past two years hint at potential challenges in user engagement. Instagram may be resonating more deeply with users in recent quarters.

Advice: Marketing teams should adapt content and social media engagement strategies based on CTR trends. Consider allocating more resources to Instagram, where CTR has shown significant improvement, while being mindful of user engagement challenges on Twitter and Facebook.


Takeaways

These numbers show a changing social media landscape that’s still largely a strong one for brands to be able to reach consumers in new and exciting ways. Brands continue to invest heavily in social media as a communication and promotional tool, and these numbers largely back up that work. But channel-specific evolutions may be altering the priorities around brands’ spends in time and resources, and these numbers can hopefully help guide any shifts your team may be considering. 

If you’d like to learn how Emplifi’s platform can help you adjust to the changing social media world, we’d love to show you more about what we do at any time.


Methodology

Emplifi's analysis is based on Q4 2023 data and year-on-year comparisons, downloaded at the beginning of January 2024.

  • Median monthly ad CPC: Calculated as median monthly ad account CPC. Per each account, we look at "total spend value/total (all) clicks," and from all of these ad accounts in one category, we calculate the median value. All values are in USD. The charts displayed in the report show the average monthly median value for a given quarter.

  • Median monthly ad CTR: Calculated as median monthly ad account CTR. Per each account, we look at quarterly "total (all) clicks / total impressions," and from all of these ad accounts in one category, we calculate the median value. All values are in USD. The charts displayed in the report show the average monthly median value for a given quarter.

  • Interactions / 1,000 impressions: Interactions on Facebook are calculated as a sum of all Reactions, Comments, and Shares on posts published by a Page. Interactions on Instagram are calculated as a sum of Likes and Comments on posts published by a profile. For charts displayed in the report, we calculated "Interaction / 1K impressions" for each post in the sample. Then median post value was calculated for each profile in the sample. In the last step, the median was calculated for the industry.

Additional terms relating to our TikTok vs. Instagram analysis:

  • Sister TikTok and Instagram Profiles: Profiles owned by the same Emplifi client on both Instagram and Tiktok that have the same handle (e.g., www.instagram.com/examplecompany and www.tiktok.com/@examplecompany.)

  • TikTok Engagements: Defined as the sum of Likes, comments, and shares.

More social media analytics news and insights

Emplifi: Why a unified data analytics tool is a must-have for actionable customer insights

Why a unified data analytics tool is a must-have for actionable customers insights

Emplifi Social Media Benchmarks 2024

The social media benchmarks to guide your 2024 strategy

Social media analytics: The complete guide

Social media analytics: The complete guide

Emplifi Press Release: Emplifi Reports Instagram Reels Outperformed All Other Video Content Across Instagram, Facebook, and TikTok

Emplifi Reports Instagram Reels Outperformed All Other Video Content Across Instagram, Facebook, and TikTok

Top Social Media Analytics Tools

The top 6 social media analytics tools for 2024

Emplifi Blog: How unifying social media analytics can benefit your brand

How unifying social media analytics can benefit your brand

Emplifi Unveils Strategic Partner Program to Help Brands Meet Modern Consumer Demands

Emplifi Unveils Unified Analytics, Providing Comprehensive Insights into the Entire Customer Journey

Emplifi - How to use AI marketing tools to increase efficiency and boost results

How to use AI marketing tools to increase efficiency and boost results

Forrester Consulting Study: Social Marketing Leaders Are In Critical Need of Integrated Data and Agile Technology

Forrester Consulting Study: Social Marketing Leaders Are In Critical Need of Integrated Data and Agile Technology

Emplifi Report: Unleashing the Power of Video: Key Trends Driving Social Media Engagement in 2023

Unleashing the Power of Video: Key Trends Driving Social Media Engagement

Emplifi Blog - How brands to use AI and stay authentically human

5 keys for brands to use AI and stay authentically human

Emplifi newsletter

Sign up for the latest insights and best practices to elevate your social marketing, commerce, and care.