2026 Gartner® Magic Quadrant™

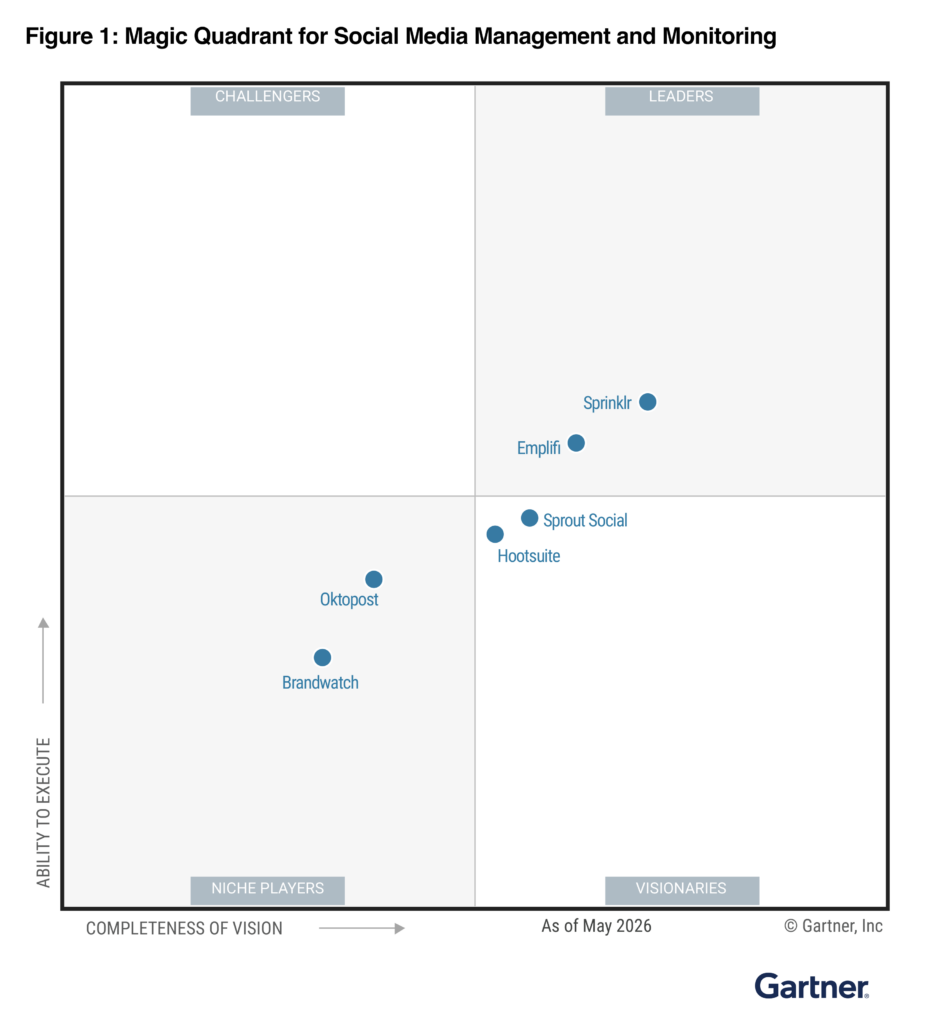
Emplifi named a Leader in the 2026 Gartner® Magic Quadrant™ for Social Media Management and Listening

Get the Report

Emplifi named a Leader in the 2026 Gartner® Magic Quadrant™ for Social Media Management and Listening Get the Report

Blog
7 min read
Sep 01, 2026

How unified social analytics platforms measure cross-channel campaign performance

A unified social analytics platform connects channel-level data with interaction effects and business outcomes in a single view. It replaces the manual work of pulling data from multiple sources to understand how a campaign has performed.

Gabriel Tay Director of Business Consulting at Emplifi
Two colleagues looking at unified analytics

Key points:

  • Fragmented analytics across separate tools can result in delayed decision-making and misattribution for your marketing campaigns
  • Cross-channel measurement involves three layers: channel performance, interaction effects, and business outcomes
  • Unified analytics platforms should provide a dashboard with three views: an executive summary, a campaign optimization view, and a full attribution view for board-level reporting
  • Start with an audit to identify your analytics gaps and expect full attribution modeling to take up to 12 weeks in total

When your CMO asks for the ROI of your latest campaign, you should be able to answer them instantly.

Instead, you provide a patchwork of different numbers that raises more questions than it answers.

The problem is that you have the data. It’s just scattered across four different tools. You have to open four separate reports and try to cajole them all into one spreadsheet to try and make sense of it all.

That’s where a unified social analytics platform makes all the difference.

It replaces those four different views with one connected dashboard that shows you what your campaign actually achieved.

Here, we explore what that actually looks like in practice.

In this guide, you’ll learn:

  • Why fragmented analytics is really a data connection problem
  • The three specific costs of running campaigns on disconnected reporting
  • The three layers of cross-channel measurement, and where most analytics platforms stop
  • What a unified dashboard should show at the executive, campaign, and attribution level
  • A realistic migration path from fragmented reporting to a single connected view

Why fragmented analytics cost more than time

When your analytics are spread across multiple tools, pulling a post-campaign report together can take days instead of minutes.

But lost time isn’t the only cost.

There are also three more factors to consider:

  1. Decision latency: If your data isn’t centralized, you might miss the opportunity to switch out an under-performing creative asset like a Facebook ad. Rather than pivoting mid-campaign, your entire budget could be spent on content that just doesn’t resonate.
  2. Attribution gaps: Paid data should live alongside your organic and care data, so that you can see what’s actually driving conversions at any one time. Teams that can only see one channel at a time have no way to credit the lift between them.
  3. Inconsistent metrics: Different platforms use similar terms, but they might have different meanings. For example, ‘reach’ is measured differently depending on the platform; sometimes it’s a precise count, sometimes an estimate. Pull the ‘same’ stat from multiple sources and you could be comparing apples with oranges.

In other words, the cost of fragmentation doesn’t just come down to the two days lost every month pulling campaign reports together.

It’s also the decisions made too late, the credit that goes to the wrong channel, and the debrief where nobody’s numbers align.

Good compared to what?

A "good" number on one platform can be a bad one on another. Get the baselines in Emplifi's 2026 Social Media Benchmarks Report.

Download now

The three layers of cross-channel measurement

Cross-channel measurement only works once you understand that every platform has its own standards and definitions.

For instance, a 20% engagement rate on TikTok and a 20% engagement rate on Instagram aren’t the same 20%.

There are three different layers to consider:

  • Layer 1 tells you what happened
  • Layer 2 tells you how the channels affected each other
  • Layer 3 tells you what it was worth

Let’s look at each one in more detail:

Layer 1: Channel performance

You might already be tracking foundational metrics such as:

  • Engagement rate
  • Reach
  • Impressions
  • Follower growth
  • Video views
  • Link clicks
  • Paid metrics

But if you’re logging them across different channels, your results might look a little off.

What you need is the same metric, defined the same way, applied consistently across every platform, so the numbers in front of you are actually comparable.

Take engagement rate on its own. The baseline moves a lot by platform.

For example, according to Emplifi’s 2026 Social Media Benchmarks Report:

  • TikTok’s median engagement rate peaked at 35.9% in Q3 2025 before easing to 27.6% by Q4 2025, still well ahead of every other platform
  • Instagram’s median engagement, over the same window, declined from around 17% in early 2024 to under 10% by late 2025
  • Facebook held largely flat, in the 1.4% to 2.4% range
  • TikTok also generated more than twice the median interactions of Instagram and over 20 times that of Facebook

However, if you report on those three channels side by side, a TikTok number that appears fine might actually be underperforming its own platform’s average, while an Instagram number that seems weak in comparison could be perfectly healthy for that channel.

Standardization can help you understand what a good result looks like on each platform, before you put them next to each other.

Emplifi Unified Analytics standardizes metric definitions across Instagram, TikTok, LinkedIn, Facebook, and X into a single comparable dataset, so that judgment call doesn’t have to rest with one person every reporting cycle.

The report your CMO actually wants

Revenue, retention, and cost, not likes. Here’s the framework for proving social pays for itself.

Layer 2: Interaction effects

This layer is more complex because it requires connecting data from different sources into one location.

A unified analytics platform will show you how each channel interacts with the next so you can quickly identify opportunities to change direction or move spend to a channel that’s working well.

Specific things to look for include:

  • Paid amplification lift: Does an organic post’s performance change after a paid boost period ends?
  • Cross-channel sentiment coherence: Is the brand landing the same way on TikTok as it is on LinkedIn, or is one channel generating a different perception of the brand?
  • Content format performance by channel combination: Does video win everywhere, or only when it’s paired with paid amplification on specific platforms?

All of this only becomes visible when the channels are read against each other in one unified dashboard.

One dashboard, not three exports

See how Unified Analytics turns paid, owned, and earned into a single Dynamic Board.

See how Dynamic Boards works

Layer 3: Business outcomes

The layer your CMO will care the most about: how is this campaign actually contributing to revenue?

Business outcomes they might ask you for include:

  • The revenue attributed to social, across direct conversion, assisted conversion, and influence attribution
  • Pipeline generated from social engagement
  • Care cost avoidance
  • Cases resolved by AI versus by a human agent
  • Customer lifetime value correlated with social engagement depth

You should be able to tell them what your campaign was worth, and what it saved the care team, across every channel.

For instance, Emplifi’s commerce integration is what connects social campaign performance through to these downstream commercial outcomes, closing the loop that point-solution analytics tools leave open.

ASUS ran into exactly this gap before consolidating onto a single platform.

With 145 team members running social across 70 markets, HQ had plenty of data and no shared way to read it.

Without shared benchmarks, every regional team was rebuilding the same reporting process from scratch.

But moving to one platform gave every market a common dashboard and a shared definition of performance, so leadership could finally see what was working in real time, instead of reconstructing it after the fact.

We were losing time and energy just pulling numbers. Without shared benchmarks or structure, every team was reinventing the wheel. We used to wait until the end of the month to reflect. Now we’re adjusting while the campaign is still live. That alone changes the tempo of how we work.
Jeff Lee
Global Head of Community & Digital Strategy at ASUS

What a unified dashboard looks like in practice

A unified analytics platform should produce three different views to serve three distinct audiences:

  1. Executive view (30 second read): This is the view a CMO opens between meetings to get a pulse check on the campaign. It should include campaign reach, engagement, sentiment, and attributed revenue in a single-screen summary. Updated daily.
  2. Campaign optimization view (10 minute read): This is the working view the marketing team uses to make weekly calls on what to scale and what to pull. Channel-by-channel breakdown, content format analysis, paid versus organic performance split, and the three highest and three lowest-performing assets of the period.
  3. Post-campaign attribution view (1 hour read): This is the view that supports the board-level debrief and shapes next quarter’s budget allocation. It should include the full attribution model, direct, assisted, and influence, across the entire campaign flight, including the care interaction data: how many cases the campaign generated, at what sentiment, resolved at what cost.

Each view serves a different decision cadence, so trying to force all three into one dashboard can get confusing and over-complicated.

One platform that holds all three views is the best way to ensure everyone is served the right data in the right format.

How to move from fragmented to unified: the migration path

If you’re the one managing a fragmented stack right now, the path to a unified view has four steps you’ll need to execute:

  1. Audit: Map which tool currently holds which data, and where the overlaps and gaps sit.
  2. Integration requirements: Identify the API connections a unified analytics platform actually needs to pull cross-channel data in.
  3. Governance: Agree on metric definitions before migration starts, not after. A unified view built on inconsistent definitions centralizes the confusion, instead of fixing it.
  4. Timeline: According to Gartner’s 2026 Magic Quadrant for Social Media Management and Listening, Emplifi’s structured implementation framework enables standard social marketing environments in one week, with complex, multiregion setups completing within 10 to 15 days, backed by tailored digital training for each role.

You’ll likely need to bring stakeholders from your marketing and care teams together to ensure everyone is catered for on a new unified analytics platform.

Final thoughts: Simplify your campaign management with one set of numbers

Fragmented social analytics can lead to inaccurate reporting, and delayed decision making.

A unified platform helps to fix that by:

  • Standardizing metrics across channels so comparisons are like for like
  • Surfacing interaction effects, like paid amplification lift and cross-channel sentiment, that single-channel tools can’t see
  • Connecting campaign performance to revenue, pipeline, and care cost outcomes
  • Giving every stakeholder, from the CMO glancing at a summary to the analyst building the board deck, the view built for their decision

Emplifi Unified Analytics is built to do exactly this. It pulls channel, interaction, and outcome data into one platform so your team can focus on optimizing campaigns instead of searching for every lost piece of data.

Ready to see what a unified view actually looks like against your own campaign data? Get a demo and we’ll walk through an analytics architecture consultation built around your current stack.

Frequently asked questions

Consolidating onto a single platform typically means fewer, not more, integration points where data changes hands, since a unified system replaces multiple point-tool connections with one governed data layer. Emplifi holds ISO/IEC 27001:2022 certification and a SOC 2 Type 2 audit report. For current security policies, data residency details, and compliance documentation, see the Emplifi Trust Center.

According to Gartner’s 2026 Magic Quadrant for Social Media Management and Listening, standard environments can be up and running in one week, with complex, multiregion setups completing in 10 to 15 days. Full cross-channel attribution modeling, the kind that supports board-level reporting, takes longer and depends on how much governance and metric-definition work happens upfront.

The direct case is time: reclaiming the hours spent manually assembling reports every reporting cycle. The larger case is decision quality: unified attribution surfaces revenue and pipeline impact that stays invisible when paid, organic, and care data sit in separate tools, which means budget decisions get made on a fuller picture rather than a partial one.

No. Unified analytics connects to existing paid, organic, and care platforms through API integrations rather than requiring a wholesale platform replacement. The audit and integration-requirements steps in the migration path above are how you determine what connects and how.