Solutions for teams
Product Modules


Customer Success Stories
All stories
Benefit Cosmetics
The beauty brand’s audience-first approach to content
Toyota
Driving customer engagement with deep insights
Kimpton Hotels
Why UGC is a critical part of their guest experience
Stanley
How the iconic brand increased product reviews and engagement
Freshpet
Streamlining customer interactions across channels
Hardee’s
Using social listening to capitalize on trending moments
Bath & Body Works
How the retailer is growing their community
Aeromexico
How the airline became one of the most loved travel brands on social
Industries
Outpace your competition
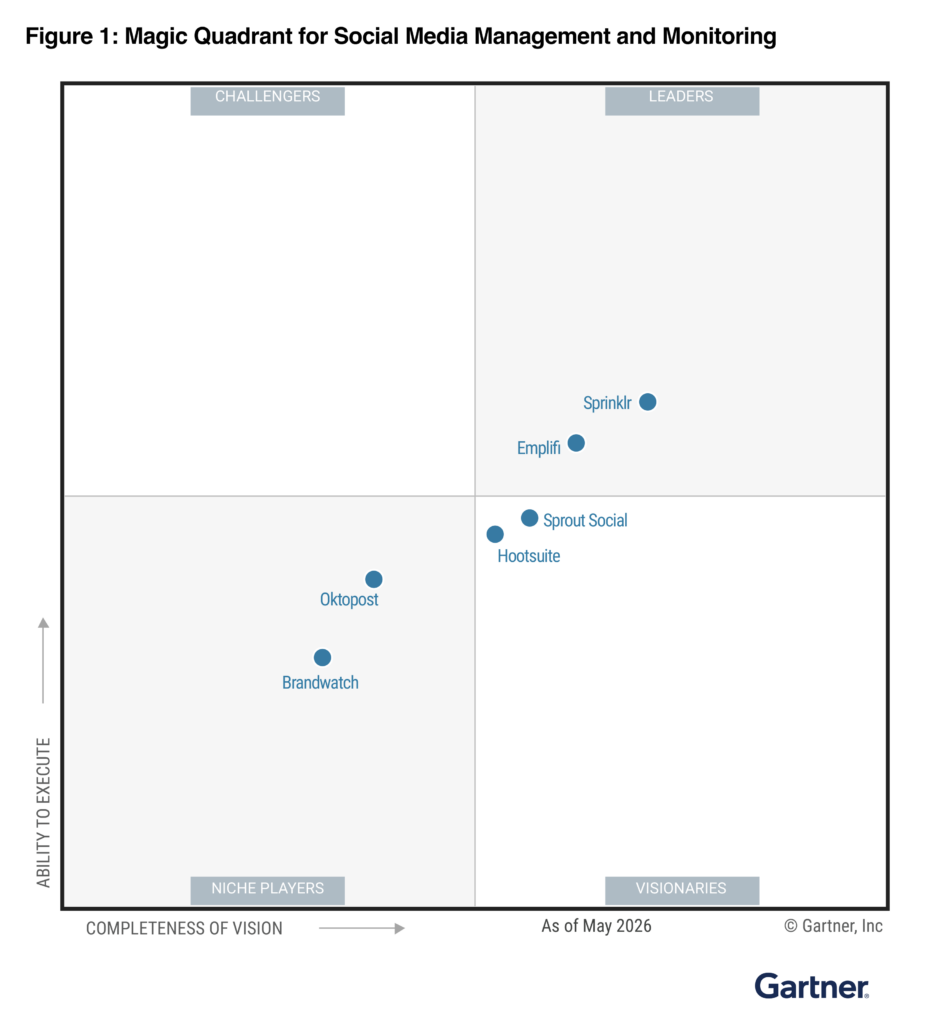
We’re recognized as a market leader in innovation and for our drive to give brands all the tools they need.


Insights
Resource Center
Your resource center for everything social marketing, commerce and care
Blog
Get up to speed on the latest trends, tips, and best practices to power your strategy
Webinars
Latest insights on marketing, commerce, and care, straight from the experts
Product Tours
Explore our product tour library and interactive demos to see Emplifi in action
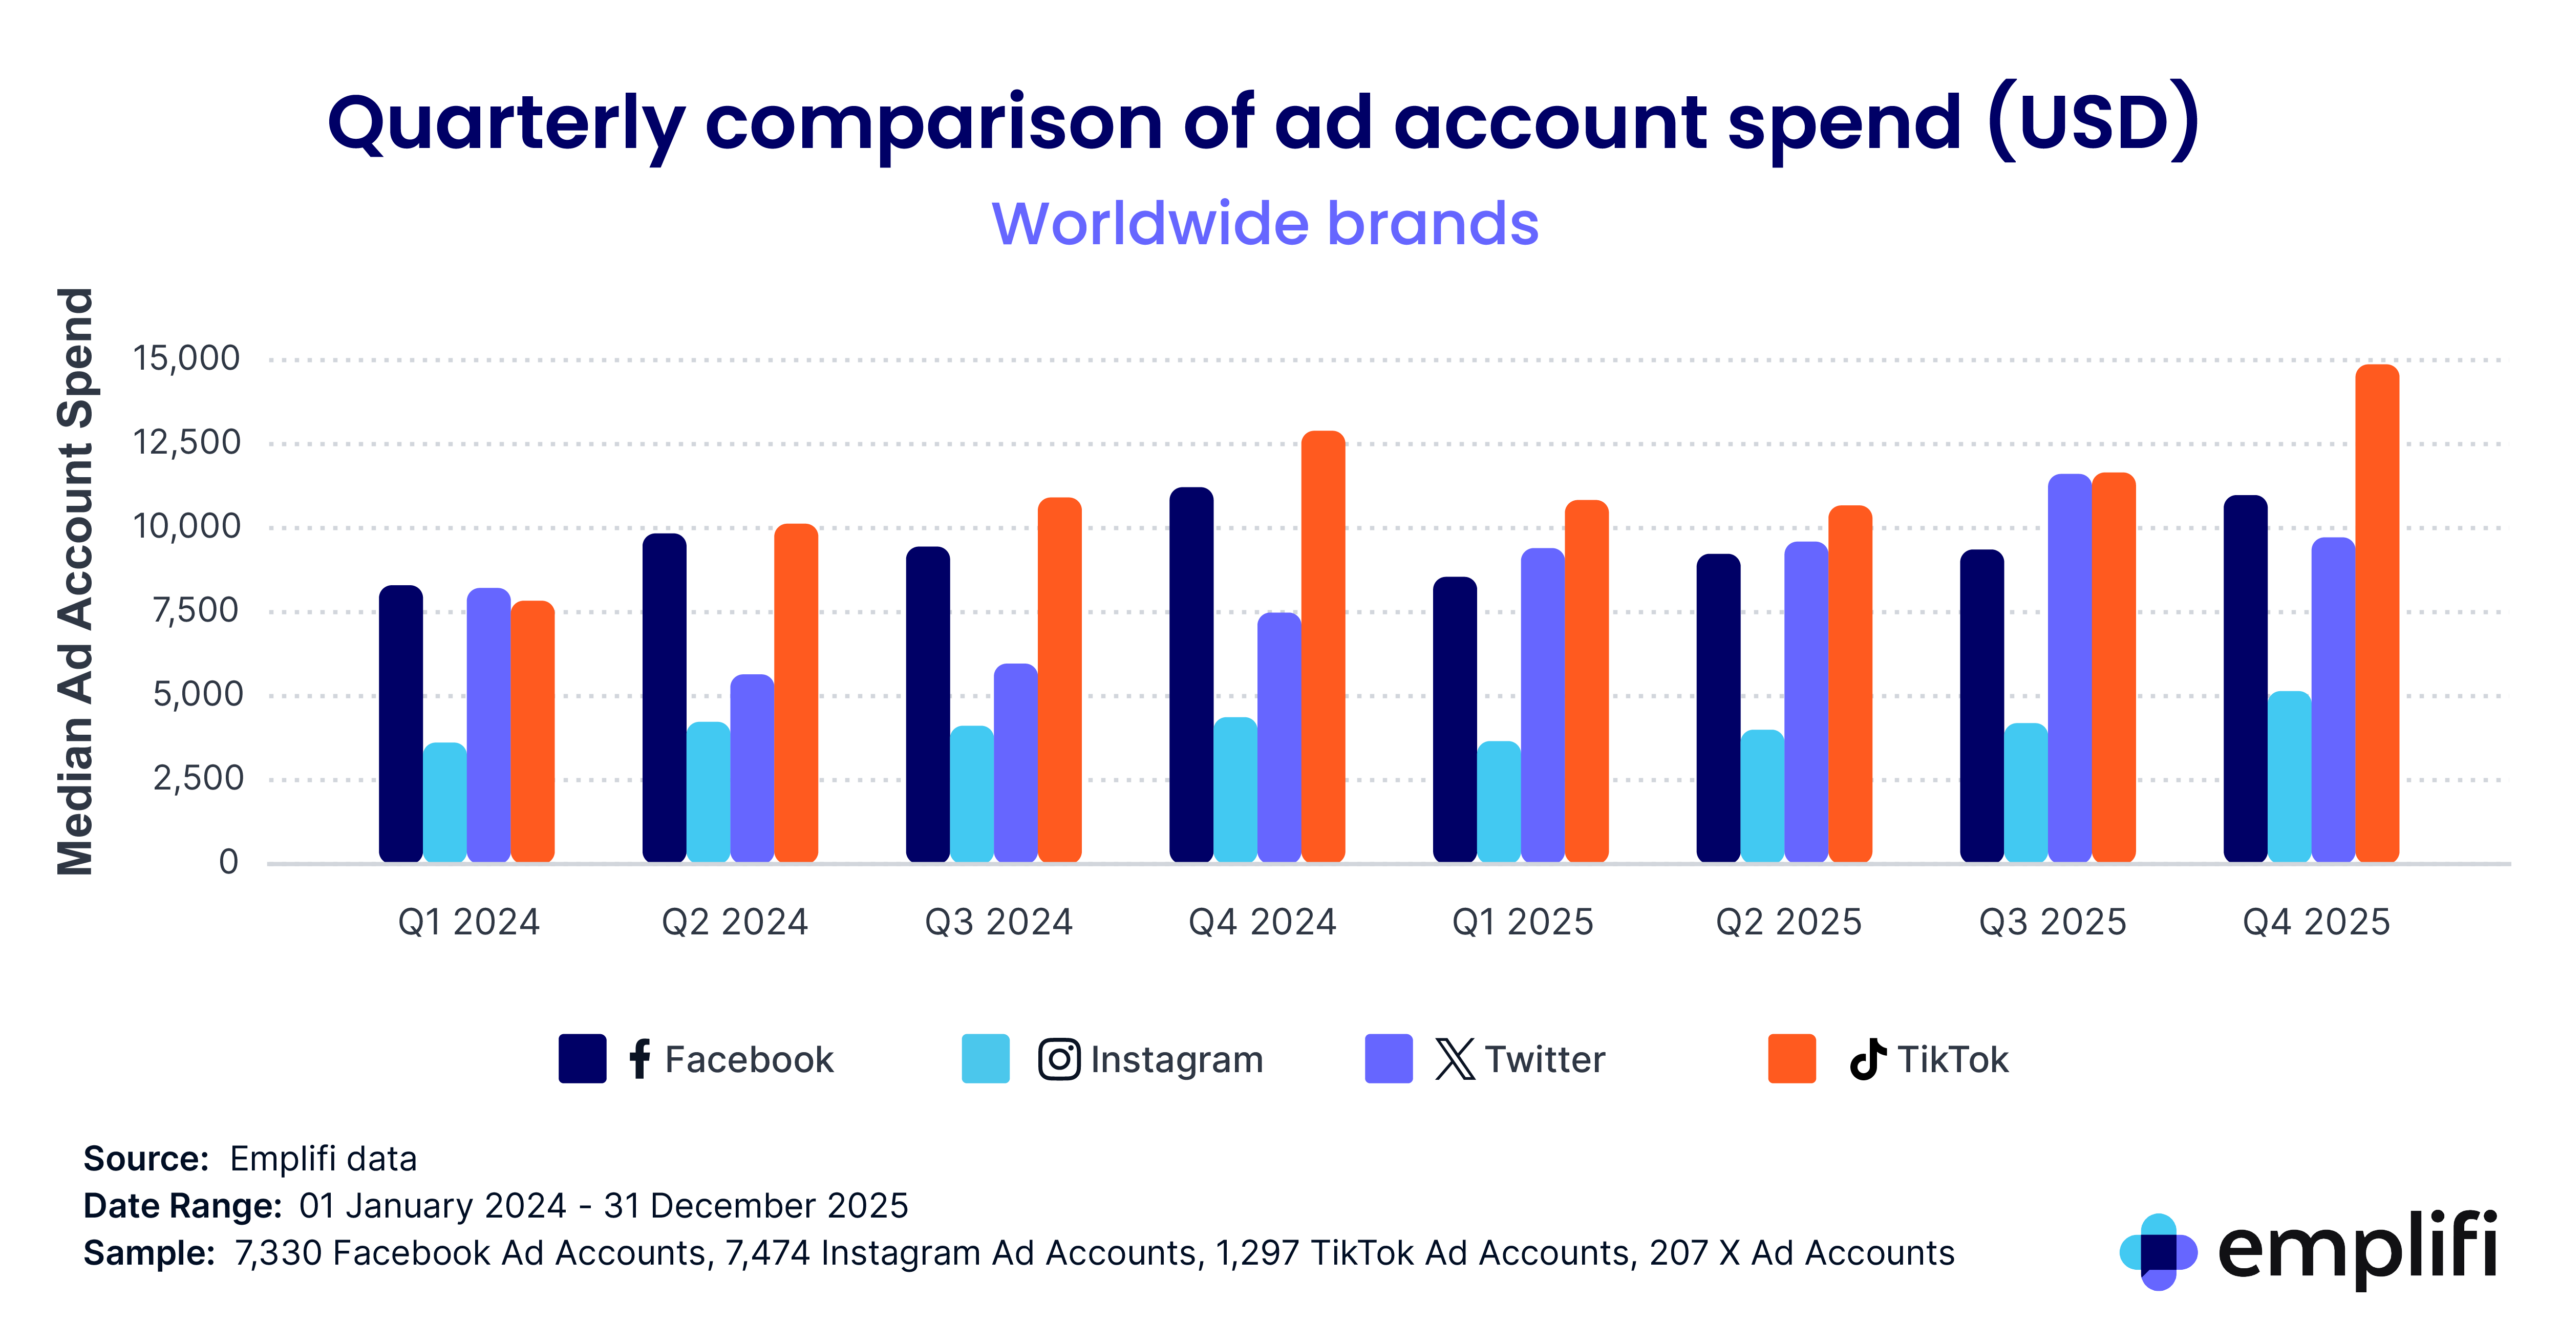
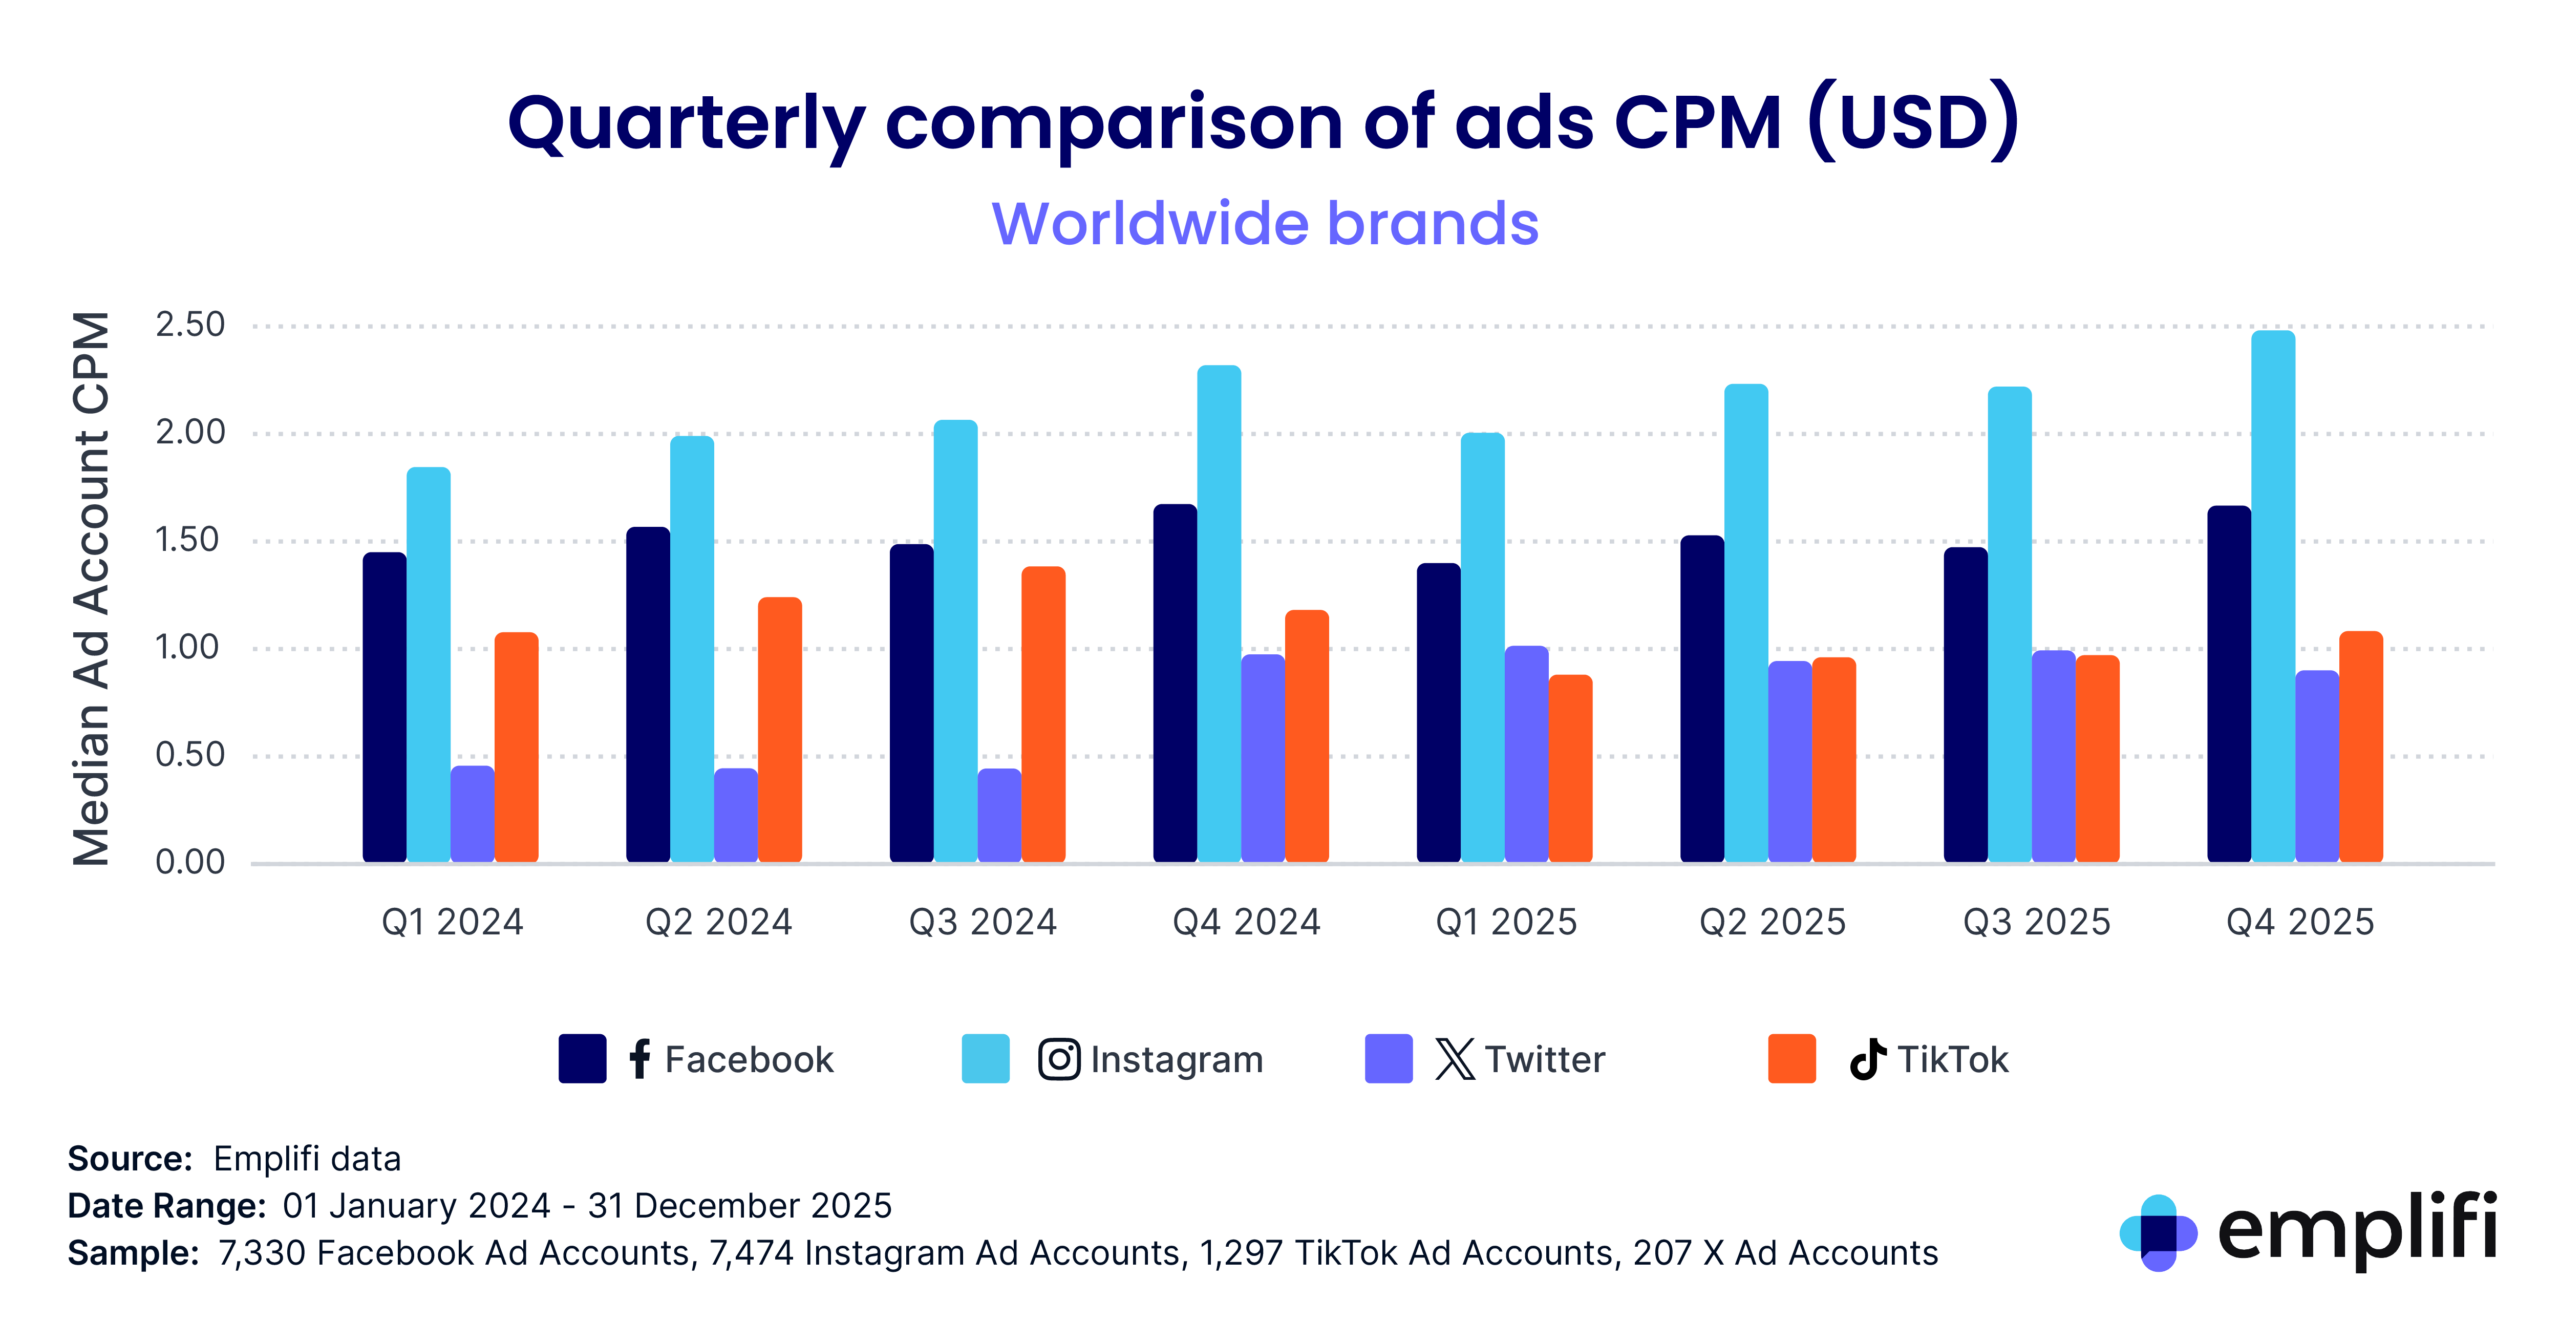
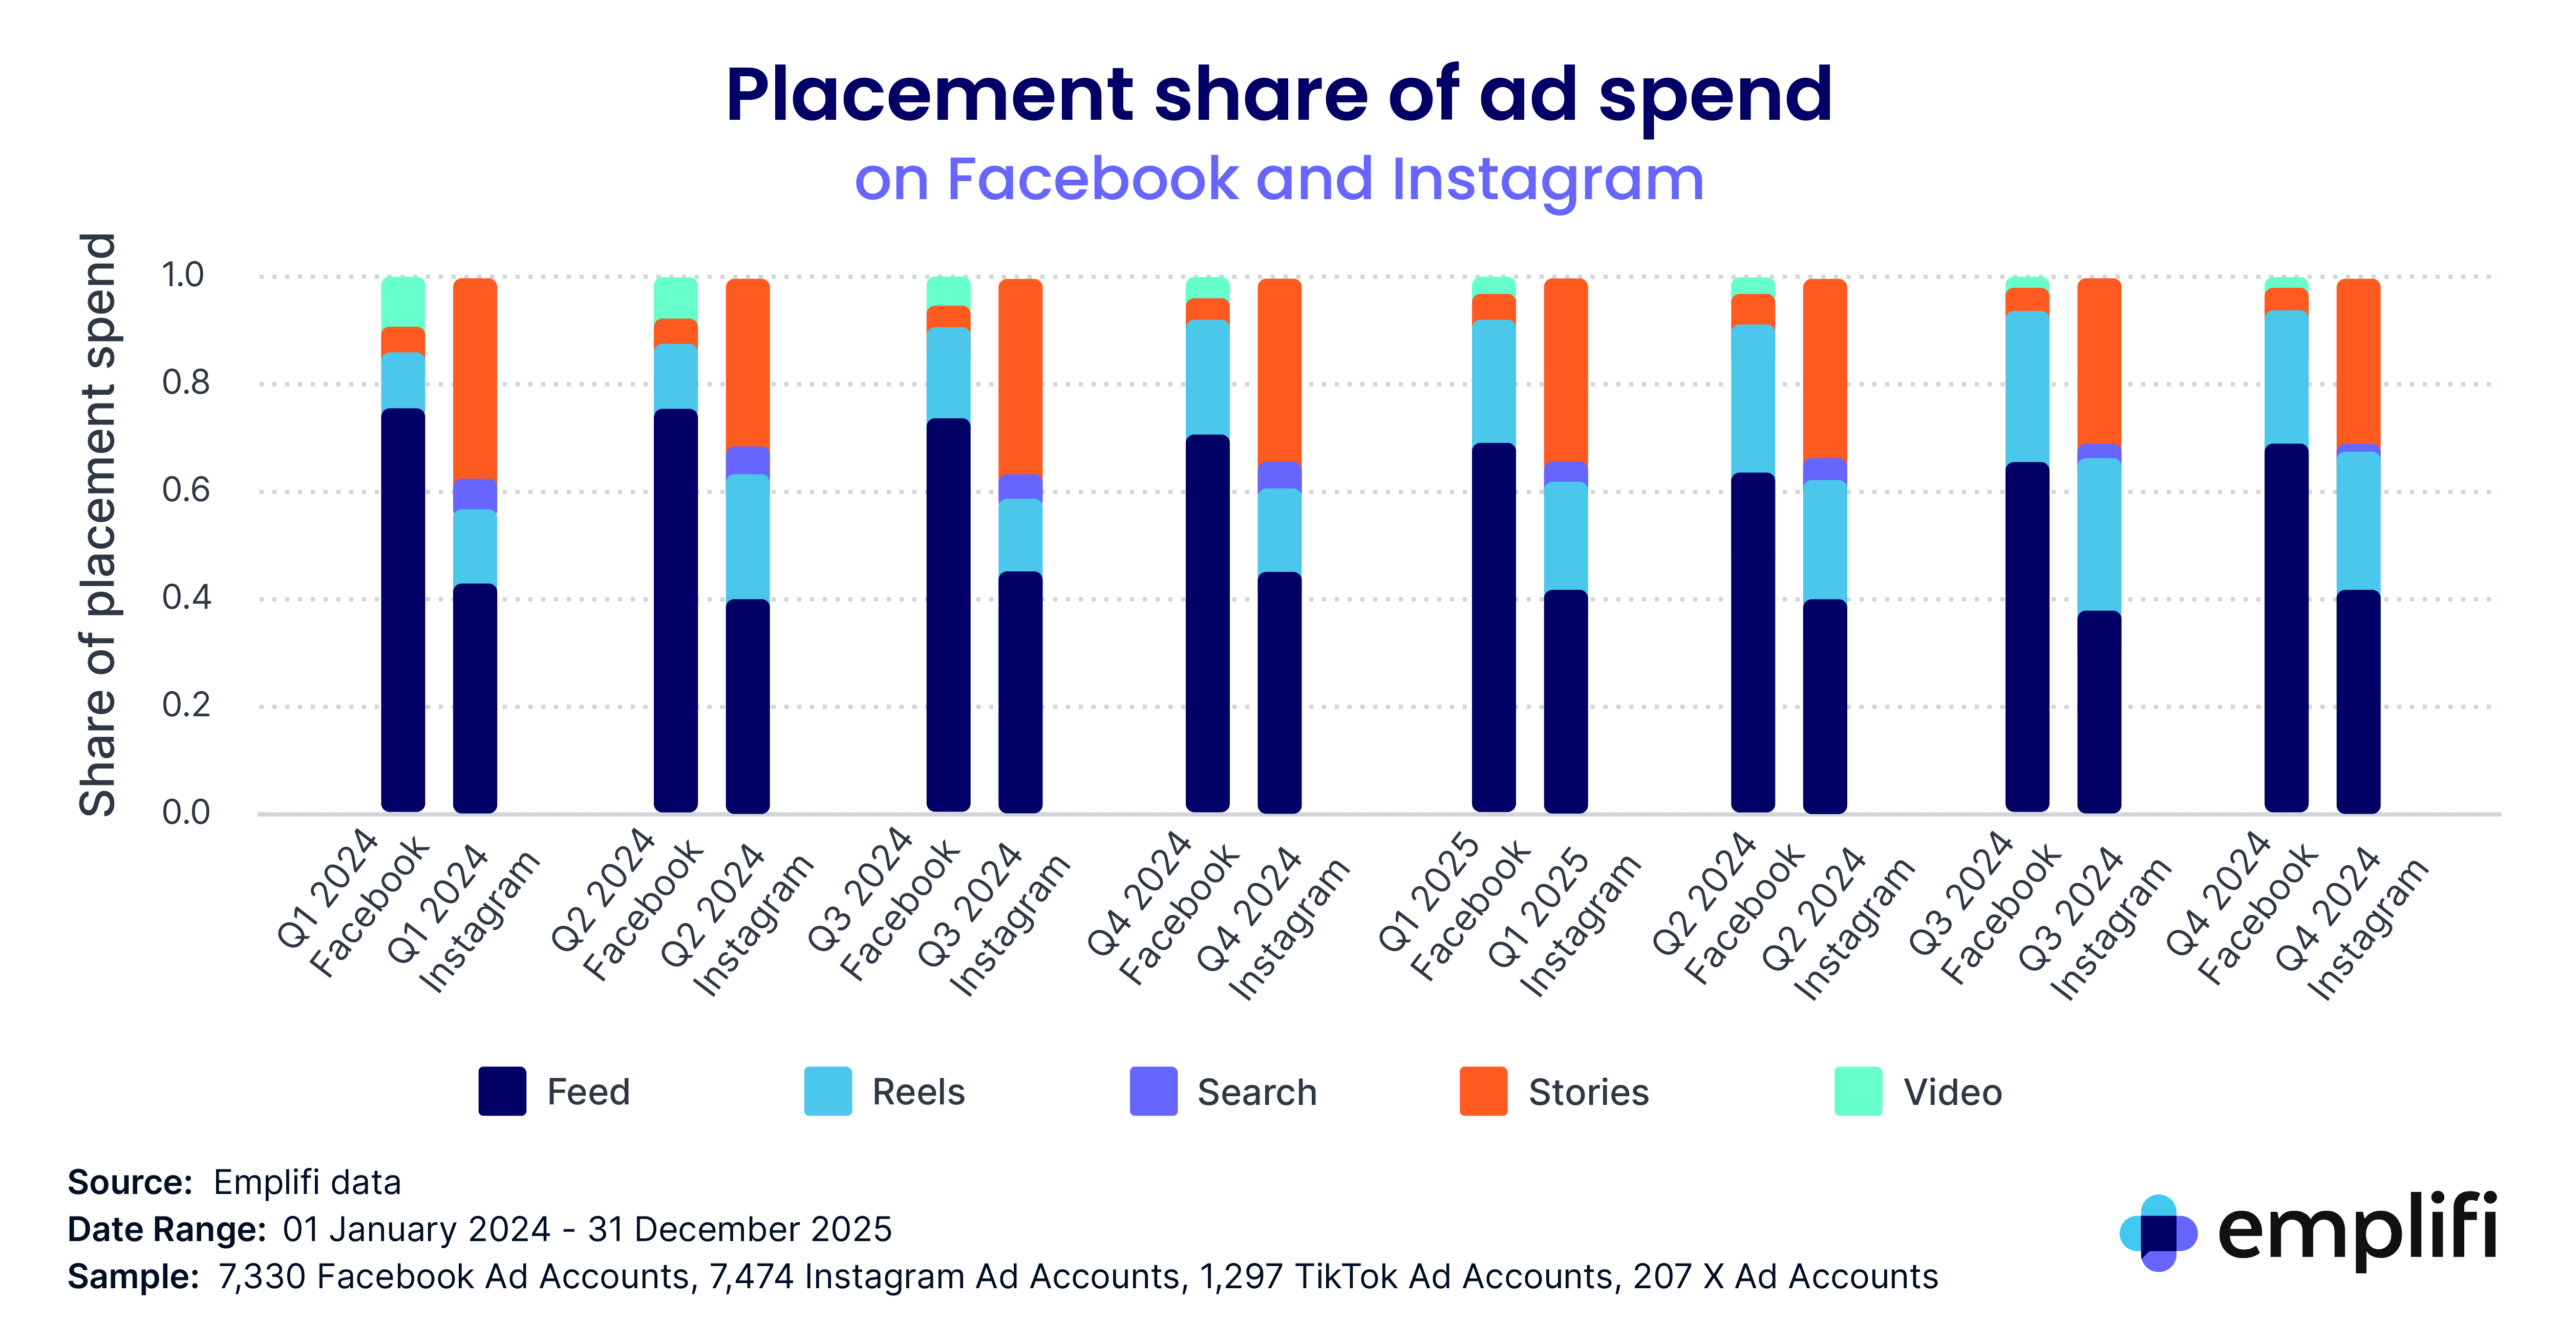
Quarterly Industry Benchmarks
Compare your social media performance with global and regional industry benchmarks
Key Terms Glossary
Explore our key term definitions
Customers