Social ad spend surged year-over-year in Q2 2026, based on Emplifi’s analysis of more than 7,700 ad accounts globally. The headline isn’t just that brands spent more; it’s that most of them got more efficient at the same time. Ecommerce led the way with the biggest gains: spend up 70%, click-through rates up 29%, cost per click down 18%.
Paid social budgets are growing. That part isn’t the story.
What’s worth paying attention to is what’s happening to efficiency at the same time. Across most of the regions and industries Emplifi tracks, brands that increased paid social investment in Q2 2026 also saw click-through rates rise and cost-per-click fall.
Higher spend. Better engagement. Lower costs. That combination doesn’t show up everywhere, and understanding where it is and why is where the useful signal lives.
This post breaks down the findings from Emplifi’s analysis of anonymized data from more than 7,700 ad accounts across global regions and industry verticals. All figures are median monthly spend, CTR, and CPC per account, compared year-over-year against Q2 2025.
Worldwide, median monthly social ad spend rose 16% year-over-year, from $5,591 in Q2 2025 to $6,476 in Q2 2026.
More notable than the spend growth is what came with it. CTR increased 18% while CPC declined 9%, from $0.213 to $0.191.
|
|---|
Brands are not only spending more, but they’re getting more return out of their efforts.
That efficiency improvement matters because it reframes the regional and vertical data below. The markets seeing the biggest gains aren’t simply outspending the market; they’re doing it in ways that are generating stronger returns.
North America recorded the largest year-over-year spend increase of any major region. Median monthly social ad spend rose 61%, from $8,277 to $13,308.
The United States drove much of that increase, with spend climbing 57% to $15,111. CTR climbed 22% to reach 1.78%, the highest of any region in the dataset, while CPC declined 3% to $0.483. U.S. advertisers scaled significantly, and audiences responded.
The United Kingdom followed the same pattern: spend up 54%, from $5,257 to $8,074, CTR up 20%, CPC down 9%. Both markets point to an environment where increased investment is being matched by improved performance, not diluted by it.
|
|---|
The U.S. engagement numbers stand out. CTR climbed 22% to reach 1.78%, the highest of any region in the dataset, while CPC declined 3% to $0.483. U.S. advertisers scaled significantly, and audiences responded.
The United Kingdom followed the same pattern: spend up 54%, CTR up 20%, CPC down 9%. Both markets point to an environment where increased investment is being matched by improved performance, not diluted by it.
Europe: quietly the most efficient market
Europe doesn’t have the headline spend numbers of North America. What it has is something more useful for benchmarking: the strongest cost efficiency improvement of any region tracked.
|
|---|
Median monthly spend increased 14% to $7,037. The CPC decline of 16% is the largest of any region in the dataset. CTR rose 20% at the same time.
European advertisers are getting more engagement per click and paying less for each one. For brands with significant European operations, that’s a signal worth acting on. The region may offer stronger efficiency returns per dollar spent than its headline spend numbers suggest.
No industry saw a more dramatic shift than Ecommerce. Median monthly social ad spend surged 70% year-over-year, from $16,426 to $27,966. CTR rose 29%. CPC fell 18% to $0.133, the lowest of any vertical tracked.
|
|---|
The investment surge has a clear rationale. eMarketer projects U.S. social commerce sales will cross $100 billion for the first time in 2026. Emplifi’s data captures what’s driving brands to scale: ecommerce advertisers increased spend 70% year-over-year while CPC fell 18%, a combination that signals a channel delivering returns that justify aggressive investment.
“The brands seeing the biggest efficiency gains on paid social aren’t just increasing budgets — they’re investing in what happens after the click. When the ad lands on relevant content, real customer reviews, and a seamless purchase experience, performance improves. That’s what this data is showing us: spend and efficiency moving in the same direction because the full journey is finally being treated as one thing.” – Susan Ganeshan, CMO, Emplifi
Fashion followed a similar pattern: spend up 37% to $18,787, CPC down 17%. Social advertising in discovery-oriented categories is maturing in ways that benefit advertisers: higher investment, better efficiency, not a trade-off between the two.
Retail was steady, with spend up 14%, CTR up 11%, CPC down 7%. Consistent with a more established vertical where incremental efficiency gains are the norm rather than step-change improvements.
Automotive is the outlier, and the most interesting one. Spend growth was modest at 9%, but CTR improved 24%, the strongest engagement gain of any industry in the dataset.
Automotive advertisers aren’t scaling budgets at the same pace as ecommerce or fashion. But the CTR improvement suggests growing consumer engagement with automotive content on social media. For automotive brands still evaluating how much paid social belongs in their media mix, that CTR number makes a meaningful case.
The Q2 data arrives at a useful moment. Brands are making H2 budget decisions now, and the benchmark data offers a few clear signals.
Efficiency and investment are moving together, not against each other. The concern that higher paid social spend means paying more for diminishing returns is not what the data shows, at least not where investment has been most focused. In North America, the U.K., Europe, ecommerce, and fashion, brands that spent more also got more.
The biggest opportunity may be in high-engagement verticals that haven’t seen the same spend surge. Automotive’s 24% CTR improvement on 9% spend growth points to an audience that’s increasingly responsive to social advertising, without the same competitive pressure that’s built up in ecommerce. For brands in similar positions, there’s headroom to scale before that window closes.
Europe’s efficiency story deserves more attention. A 16% CPC decline alongside a 20% CTR increase should prompt brands with significant European operations to revisit their paid social strategy. The region may offer stronger returns per dollar than its headline numbers suggest.
The IAB projects U.S. social media ad spending will grow 14.6% in 2026, outpacing every other digital channel. Emplifi’s Q2 data suggests the acceleration in key markets is already running ahead of that forecast. As peak season approaches, the window to get ahead of intensifying competition is narrowing.
Methodology: Emplifi’s Q2 2026 Social Ads Benchmark Report analyzes anonymized data from more than 7,700 ad accounts across [platform list], spanning global regions and industry verticals. Figures represent median monthly spend, click-through rate (CTR), and cost-per-click (CPC) per account. Year-over-year comparisons reflect Q2 2026 (April through June 2026) versus Q2 2025 (April through June 2025). Benchmarks are segmented by region, country, and industry; sample sizes vary by segment.
Emplifi’s benchmark data is drawn from anonymized advertising data from more than 7,700 ad accounts across global regions and industry verticals. All figures represent median monthly spend, click-through rate, and cost-per-click per account. Year-over-year comparisons reflect Q2 2026 (April through June 2026) against Q2 2025. Sample sizes vary by segment.
The 70% year-over-year increase in ecommerce social ad spend reflects a channel that’s delivering measurable returns. CPC fell 18% over the same period, to $0.133, the lowest of any vertical tracked. Brands scaling investment are also seeing cost efficiency improve. eMarketer’s projection that U.S. social commerce will cross $100 billion in 2026 gives additional context: brands are following the money.
Europe posted the strongest efficiency improvement of any region, with CPC declining 16% year-over-year, the largest decline in the dataset, while CTR rose 20%. Spend growth was more moderate at 14%, making Europe a market where efficiency gains are outpacing raw investment increases.
The data points to a consistent pattern: the regions and verticals where brands scaled paid social most aggressively are also where efficiency improved most. For H2 planning, that means identifying markets and industries where engagement signals are strong but spend hasn’t yet caught up, and getting in before competition intensifies further heading into peak season.
The IAB projects U.S. social media ad spending will grow 14.6% in 2026, outpacing every other digital channel. Emplifi’s account-level data suggests the acceleration in key markets like North America and ecommerce is already running ahead of that forecast, with year-over-year increases of 57% to 70% in those segments.
Discover what Emplifi can do for you. We turn small teams into large ones, and large teams into well oiled machines, but either way, we offer the rocket ship, you just need to jump on.
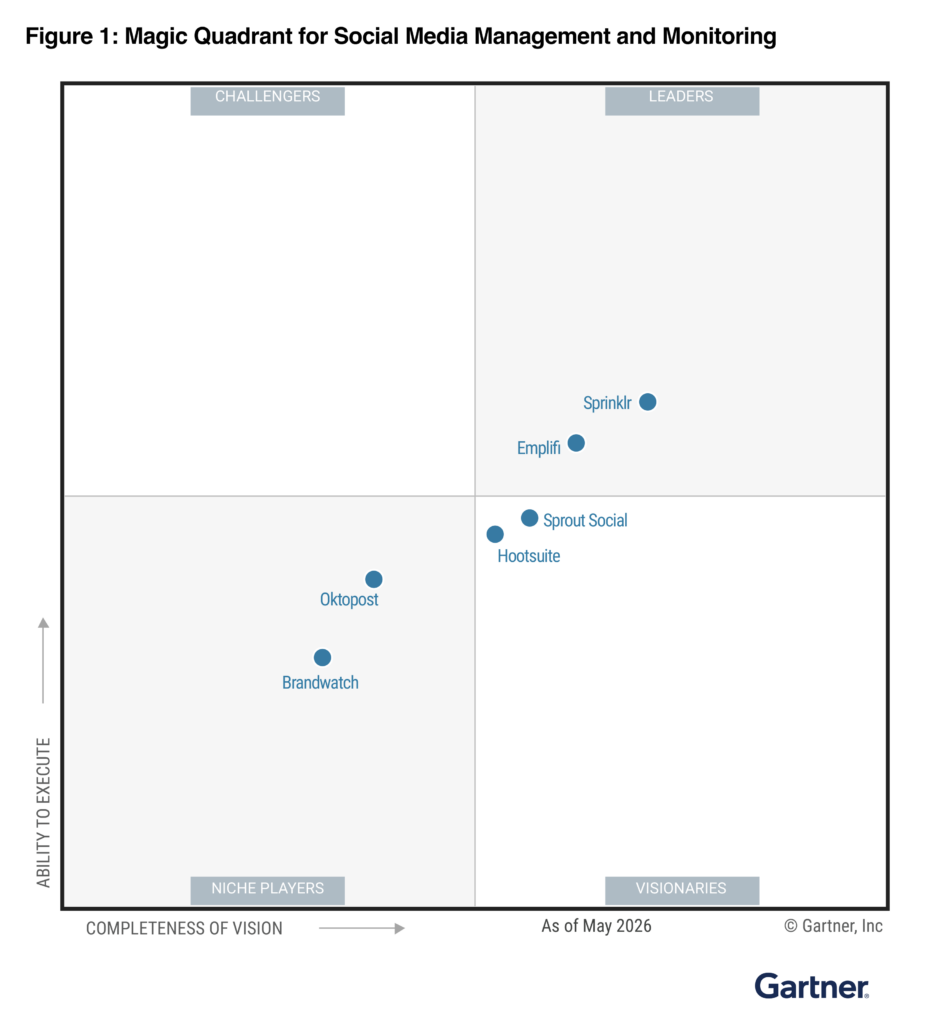
We’re recognized as a market leader in innovation, customer support, and ease of use from these organizations.