EMPLIFI FUEL AI

Tell Fuel AI what you need. It gets it done. You approve everything.

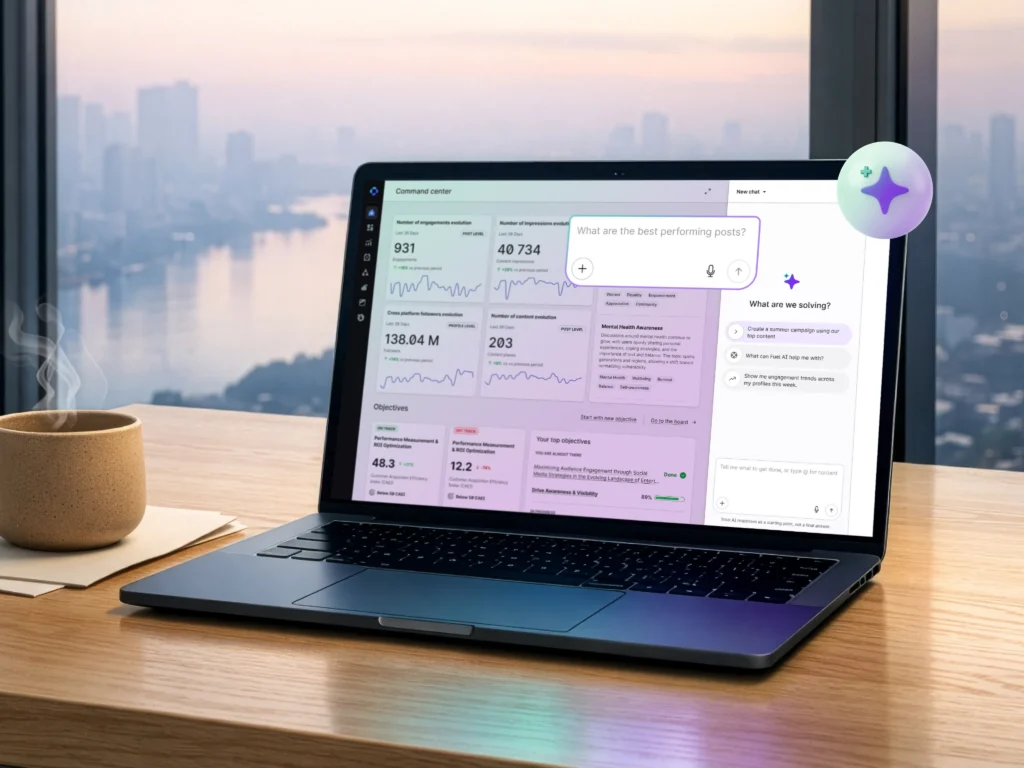
See how our agentic layer saves you hours

Tell Fuel AI what you need. It gets it done. You approve everything. See how our agentic layer saves you hours

Blog
10 min read
Oct 28, 2026

How to track the halo effect of social on other channels and prove its full revenue impact

The social media halo effect is social’s impact beyond the social team’s own reports: it often shows up in branded search, eCommerce conversion, care costs and customer sentiment. Measure each one against a clear baseline, then bring the results into one view for your CFO: the estimated revenue from search lift, the cost avoided in care, and a sentiment trend to compare against NPS.

Claire Wilson Chief Marketing Officer at Emplifi
Three colleagues in an office lounge review printed charts and a laptop together while discussing results

Key points

  • Last-click attribution can discount social’s awareness and consideration role, and dark social is hard to track with standard analytics
  • Four areas to investigate are branded search, eCommerce conversion, care costs and customer sentiment
  • Commerce conversion has the strongest Emplifi evidence: Emplifi’s Q3 2026 benchmarks show an average 11.49x uplift in conversion rate for brands using Emplifi UGC
  • Bring three numbers together for your CFO: estimated revenue from search lift, estimated care cost avoided and the sentiment trend

Your CFO is about to ask a question that impressions alone can’t answer: what’s the revenue return on your social spend and your care investment?

Whether you lead digital marketing or customer experience, you’ll want a solid answer ready.

Unfortunately, the metrics you might already be focusing on, like impressions, engagement and CSAT describe activity or individual outcomes, but they don’t necessarily show how social contributes to wider business performance.

The metrics that can help tell that story sit outside the social dashboard. They show up in:

  • Branded search
  • eCommerce conversion
  • Care costs
  • Customer sentiment

These are places to investigate the social media halo effect. Here’s how to do it.

In this guide, you’ll learn:

  • Why last-click attribution and dark social make social’s impact hard to see
  • How to measure four potential halo effects: branded search, eCommerce conversion, care costs and customer sentiment
  • How to estimate the business value of each one
  • How to bring the results together in a view that marketing, customer experience and finance can use

Why is social media attribution so hard to prove?

When people say social is hard to measure, they’re usually describing one of three tracking problems:

  1. Last-click attribution gives social little credit: It credits the final touchpoint before a purchase, while social often works earlier, in awareness and consideration. Our guide to five reports that demonstrate social’s contribution to revenue explores additional ways to report on that contribution.
  2. Dark social is hard to track: People share links in private messages, group chats and email, and a resulting visit may be recorded as direct traffic, leaving the original social referral unclear. Our guide to the dark social era explains why these journeys can be difficult to attribute.
  3. Customer journeys rarely start and end on social: Someone might see a post, search for your brand a few days later, read reviews on a product page and then buy. Social reporting sees the first step, while web analytics may credit the final one, so without a joined-up approach, the chain is hard to see.

Instead of relying on last-click attribution alone, measure what happens across other channels and test whether social activity may have contributed to the final conversion.

Four useful areas to investigate are search, commerce, care and customer sentiment. Here’s how to test each one.

See how Emplifi connects social to business results

We’ll show you how Emplifi brings your social, commerce and care data together so you can measure where social’s influence shows up.

How does social influence branded search?

Social campaigns can prompt people to look for a brand later, which may show up as growth in branded search.

Branded searches can be commercially valuable, but the size of that value depends on your own search conversion rate, order value and any other activity happening at the same time.

How to measure it: Pull branded query volume from Google Search Console for three windows: before the campaign, during it and after it. Compare the campaign and post-campaign windows with a baseline, accounting for seasonality, paid search activity, promotions and other campaigns that could affect demand.

How to estimate its value: Multiply the additional branded clicks by your conversion rate and average order value:

Estimated search halo revenue = additional branded clicks × conversion rate × average order value

Treat this result as an estimate, not proof that social caused every additional click or sale.

Some of the lift may have happened anyway, and reporting may already credit part of the resulting revenue to search.

Emplifi can take care of the social half. In Emplifi Publisher, every post assigned to a campaign is tagged with consistent UTM parameters and a unique campaign ID, so your campaign windows and social-referred traffic show up cleanly in Google Analytics.

Emplifi Unified Analytics then lets you compare performance across date ranges, and AI Wizard builds charts from plain-English questions, such as which campaign delivered the strongest results last quarter.

Google Search Console still supplies the branded query data, so add it as an export alongside.

How does social content affect eCommerce conversion?

Social content can influence what shoppers discover and the evidence they see when deciding whether to buy.

For instance, user-generated content (UGC), such as customer photos and videos, can be displayed on product detail pages to help shoppers evaluate a product.

And Emplifi’s Q3 2026 social media benchmarks also found that brands using Emplifi UGC saw an average uplift of 11.49x in conversion rate and 4.84x in repeat website visits across Emplifi’s Worldwide brands benchmark.

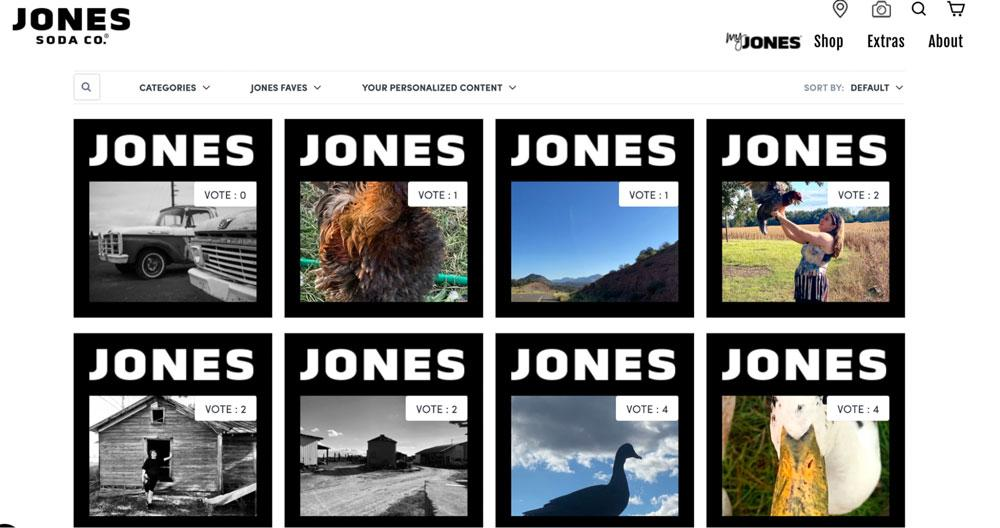
Jones Soda shows what this can look like on the product page. With Emplifi’s Shoppable Gallery Badges, shoppers can buy straight from the UGC on its site, which lifted average order value by 48% and time on site by 55%.

Jones Soda myJones gallery on the Jones Soda website showing customer photos on Jones labels with vote counts

We saw a direct impact on our DTC business because of Emplifi and it made for a much more frictionless experience and majorly upgraded our galleries.
Jones Soda team

How to measure it: Compare product detail page conversion rates for pages featuring campaign-generated UGC with comparable pages that don’t. Where possible, stagger the rollout so some comparable products act as a control group. This gives you a stronger basis for assessing the effect than a simple before-and-after comparison.

How to estimate its value: Apply the measured conversion difference to the relevant traffic, then calculate the resulting revenue using your average order value. Account for other changes that could affect conversion, and be clear about whether the estimate represents association or a tested incremental effect.

A woman in glasses sitting on a sofa at home, looking at her smartphone

Read the UGC conversion playbook

See how UGC, ratings and reviews help shoppers decide on product pages.

Read the playbook

How can social content help reduce customer care costs?

Social content may reduce care costs by answering common questions before customers contact support. This is the halo your care leader likely cares about most.

When social content answers common questions before customers need to contact support, it may help reduce avoidable cases.

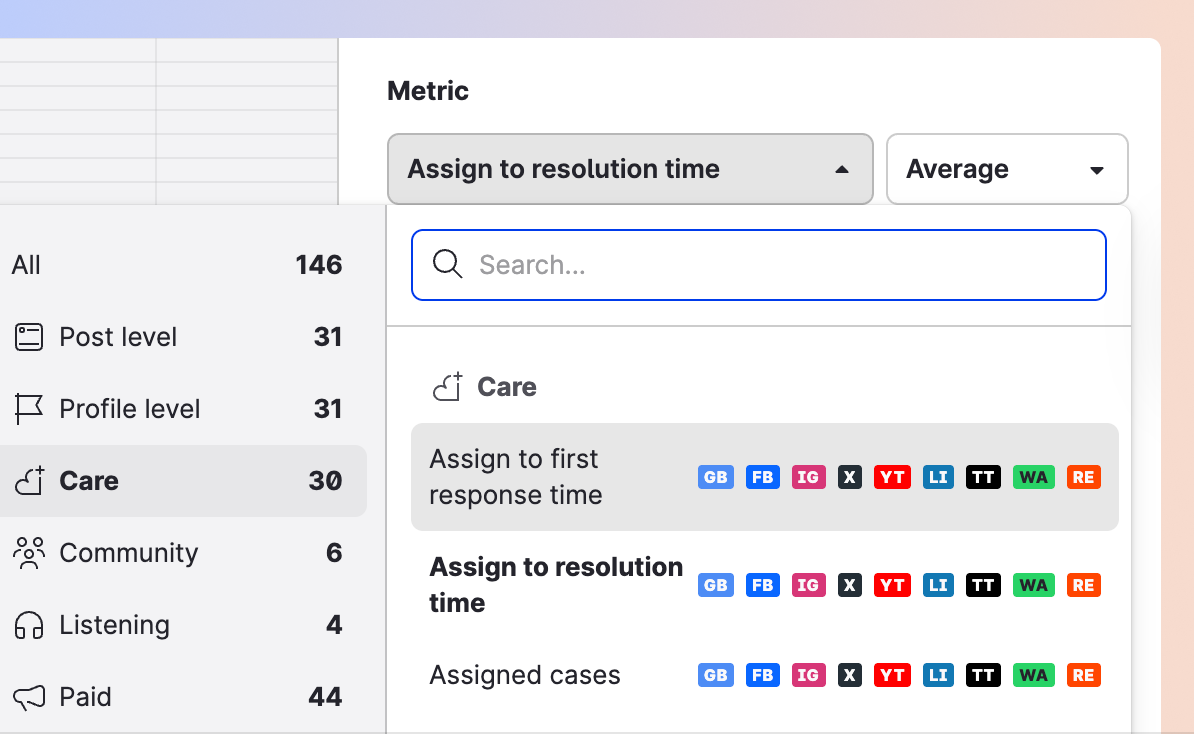
How to measure it: Start with Emplifi Listening to identify the topics customers raise most often. Publish content that addresses one of them, then compare case volume for the matching category or reason code in your care reporting before and after publication.

Dynamic Boards metric picker listing Care metrics such as assign to resolution time

Where possible, use a comparison category without new social content to help distinguish the effect of the content from wider changes in case volume. Also check whether customers are switching to another support channel rather than avoiding contact altogether.

How to estimate its value: Multiply the number of cases demonstrably avoided by your average cost per case:

Estimated care cost avoided = cases avoided × average cost per case

Can social sentiment act as an early signal for NPS?

Social sentiment can act as an early signal for NPS, but only if your own data shows that it does. Surveys tell you how customers felt when they responded, whereas social sentiment can provide a more continuous view of what customers are saying.

Whether it changes before Net Promoter Score (NPS) does is something to test.

For example, a decline in social sentiment might happen before a decline in NPS, because customers sometimes post about a poor experience before responding to a survey.

If that relationship holds for your brand, social sentiment could help your team investigate emerging customer experience issues earlier.

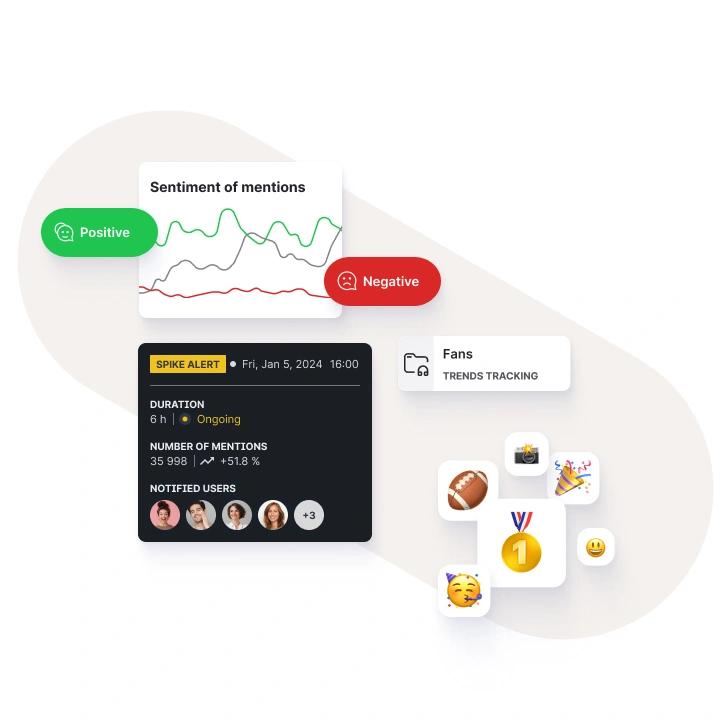
Emplifi Listening chart of positive and negative sentiment of mentions beside a spike alert

How to measure it: Export sentiment trend data from Emplifi Listening and compare it with your NPS survey results at different time lags, such as four and eight weeks. You can run the comparison in a spreadsheet or another analytics tool. Look for consistent patterns over several quarters before treating sentiment as an early-warning indicator.

How to use it: Report sentiment alongside NPS and document any relationship you’ve validated with your own data. If sentiment deteriorates, use it as a prompt to investigate what customers are saying and decide whether action is needed.

How do you build a CFO dashboard for social?

A CFO dashboard for social should bring three headline numbers into one view: estimated revenue from branded search lift, estimated care cost avoided and the sentiment trend against NPS. The four halo channels only help if they lead to a clear business story.

The goal is a shared view that marketing and customer experience can present together, with transparent calculations and clearly labeled estimates.

The dashboard can draw on five sources:

  • Google Search Console for branded query volume
  • Emplifi Unified Analytics for campaign and UGC performance
  • Care reporting for case volume
  • Emplifi Listening for sentiment
  • NPS survey data

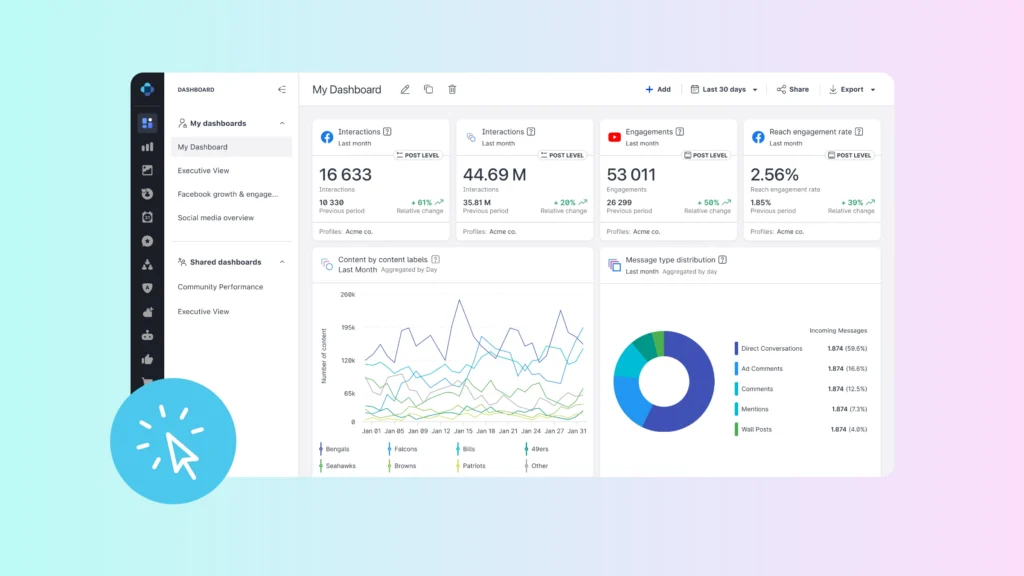
Emplifi Unified Analytics can help bring all of your data together. Here’s how to present it:

Headline number What it tells the CFO Data sources Owner
Estimated revenue associated with branded search lift Whether branded search increased during or after social activity Google Search Console, campaign reporting Marketing
Estimated cost avoided in care Whether relevant care contacts declined and what that may mean for cost to serve Emplifi Listening, care reporting, finance cost per case Customer experience
Sentiment trend against NPS Whether social sentiment and survey results show a consistent relationship Emplifi Listening, NPS survey data Shared

Review revenue and cost figures monthly, in line with finance’s reporting cadence.

Keep the dashboard focused on what changed, which activity coincided with that change, how confident you are in the interpretation and what you’ll do next.

Marketing’s revenue story and customer experience’s cost story can complement each other, provided the calculations and caveats are clear.

Final thoughts: Test where social’s influence shows up

Social’s wider business impact is worth investigating, but credible measurement requires more than connecting two trends and assuming one caused the other.

To make the case well, you should:

  • Measure branded search, eCommerce conversion, care costs and customer sentiment against clear baselines
  • Label every figure as an estimate, and show the assumptions behind it
  • Use control groups where you can, and test the sentiment-to-NPS link over several quarters
  • Present three numbers together, with marketing and customer experience each owning their half

Emplifi Unified Analytics, powered by Fuel AI, the agentic intelligence layer built into Emplifi Fuel, brings social, commerce and care data together, with Emplifi Listening and Emplifi Care supplying the sentiment and care data behind these measures.

Two colleagues examine a tablet in an office

Want to see how this could work with your own data?

Get a demo of Emplifi to explore how its social, commerce and care capabilities could support your measurement approach.

Get a demo

Frequently asked questions

The social media halo effect is the influence social activity has on results outside social reporting, such as branded search, eCommerce conversion, care costs and customer sentiment. It’s difficult to see in last-click attribution because these outcomes may appear in other teams’ data.

A brand runs a social campaign and branded searches rise in the weeks after it, while search reporting may get the credit for the resulting sales. UGC on product pages is another example: Jones Soda lets shoppers buy straight from the UGC on its site, which lifted average order value by 48% and time on site by 55%.

Measure the areas where social’s influence may show up, such as branded search, eCommerce conversion, care costs and customer sentiment, against a clear baseline. Use control groups where you can, label every result as an estimate and present the numbers together. Emplifi’s guide to social media ROI covers the wider return on social spend.

Compare branded query volume in Google Search Console before, during and after a campaign against a baseline from a comparable period. Then multiply the additional branded clicks by your conversion rate and average order value. Treat the result as an estimate, not definitive proof that social caused the increase.

It’s a hypothesis worth testing, not an established rule. Compare sentiment data from Emplifi Listening with NPS results at different time lags over several quarters before relying on sentiment as an early-warning signal.

Start with estimated revenue associated with branded search lift, estimated care cost avoided and sentiment trends compared with NPS. Include the data sources, calculation method, reporting period and assumptions for each measure. Add external data such as Search Console and NPS exports where needed.

Emplifi’s published research provides useful context, including Q3 2026 UGC conversion and repeat-visit benchmarks. These data points support the relevance of commerce measures, but they aren’t a universal benchmark for social’s halo effect.

Ready to fuel your teams with A-CX?

Discover what Emplifi can do for you. We turn small teams into large ones, and large teams into well oiled machines, but either way, we offer the rocket ship, you just need to jump on.

What can you expect?

  • A live walkthrough of Emplifi Fuel tailored to your specific social marketing, commerce, and care needs
  • A benchmark of how your brand performs against peers in your industry
  • A partner who understands your business, and 22,000 others
  • A concrete action plan to go from disjointed teams to A-CX
Get a demo