2026 Gartner® Magic Quadrant™

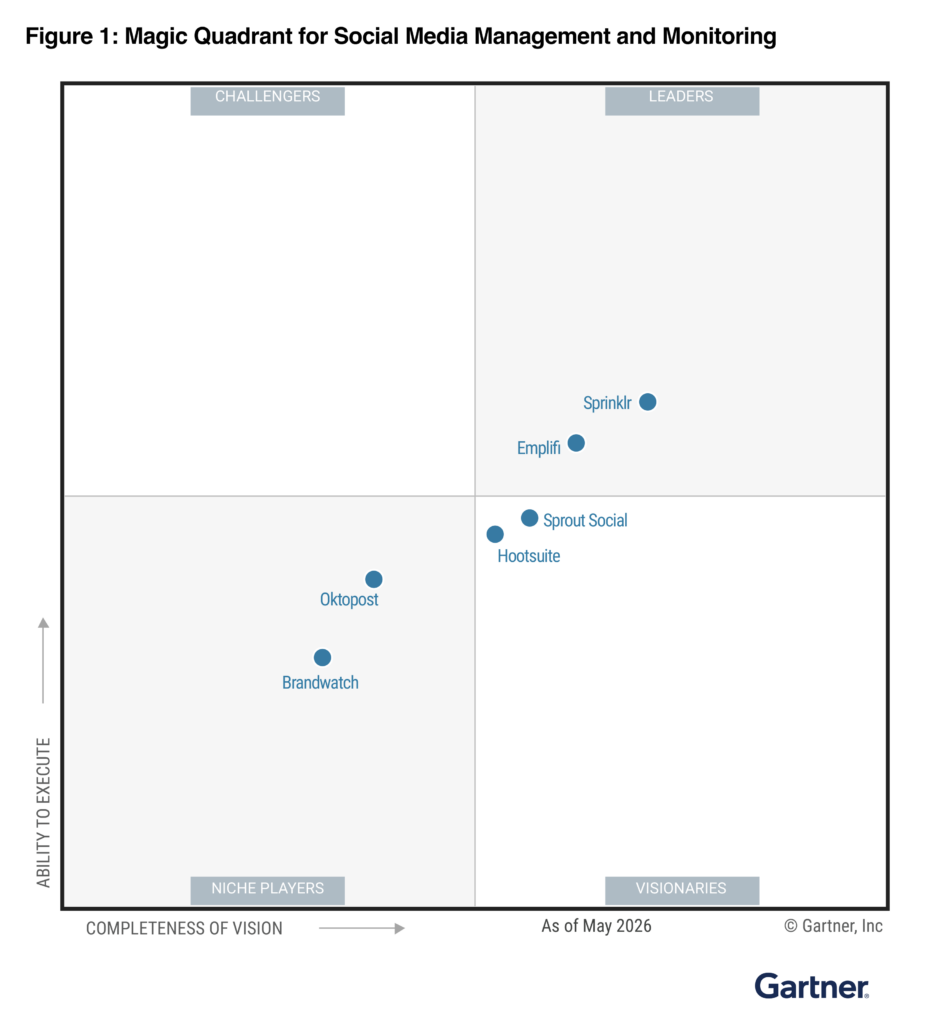
Emplifi named a Leader in the 2026 Gartner® Magic Quadrant™ for Social Media Management and Listening

Get the Report

Emplifi named a Leader in the 2026 Gartner® Magic Quadrant™ for Social Media Management and Listening Get the Report

Blog
11 min read
Oct 15, 2026

Q3 2026 social media benchmarks: Instagram engagement climbs, shares rank No. 2

Emplifi’s Q3 2026 social media benchmarks show Instagram engagement rate per impression up 68% worldwide and 97% in the US year over year, as Instagram interactions held steady. Shares, now counted alongside saves and reposts, are the No. 2 interaction behind likes. The gains came as impressions per brand post fell across every network Emplifi tracks, while more sharing moves into private channels.

Jordan Lukes Director of Corporate Marketing
Smiling young woman in a denim shirt at a cafe window table, looking down at the smartphone she holds in both hands

Emplifi tracked 167,493 Facebook pages, 77,038 Instagram profiles and 1,301 TikTok profiles worldwide in Q3 2026, including 23,144 Facebook pages and 11,515 Instagram profiles in the United States. Here’s how brand performance changed from Q2 to Q3 2026, and from a year ago, with US and worldwide numbers side by side. For your own industry or region, see Emplifi’s industry benchmarks.

Instagram engagement rate per impression rose 68% worldwide and nearly doubled in the US

A note on the metric: Emplifi now calculates engagement rate as interactions divided by impressions, instead of reach, because Facebook no longer provides reach data. Every quarter here uses the new definition, Q3 2025 included. These rates are comparable with each other but not with engagement rates in earlier Emplifi reports. Our guide to social media engagement covers the wider picture.

  • Instagram engagement rate per impression: 1.52% worldwide, up 68% from 0.91% in Q3 2025, and 1.51% in the US, up 97% from 0.76%
  • Instagram interactions: 34 per post worldwide (35 in Q3 2025, 34 in Q2) and 29 in the US (30 in Q3 2025, 28 in Q2)
  • TikTok engagement rate: 1.94% worldwide, up 20% from 1.61% in Q3 2025
  • Facebook engagement rate: 0.49% worldwide (0.48% in Q3 2025 and in Q2) and 0.36% in the US (0.39% in Q3 2025 and 0.42% in Q2)
  • Facebook and TikTok interactions: Facebook 14% lower year over year worldwide and 20% lower in the US; TikTok 38% lower worldwide

Instagram’s rate rose because interactions stayed put while impressions fell. Most of the rise arrived by Q2 2026. Worldwide, the rate then held near that level, at 1.58% in Q2 and 1.52% in Q3; in the US it kept climbing, from 1.38% to 1.51%. September 2026 was the strongest month in the 15-month window, at 1.67% worldwide and 1.63% in the US.

Actionable insight: On Instagram, the people you reach interact about as much as they did a year ago. Make engagement rate per impression your headline KPI for Q4, and measure your Instagram posts against the medians above: 1.52% worldwide and 1.51% in the US.

See where your brand stands

Get a free, personalized assessment of how your reach, engagement and shares compare with these Q3 2026 benchmarks.

New in the Q3 2026 social media benchmarks: Saves, shares and reposts as interactions

From this quarter, Emplifi counts saves, shares and reposts in Instagram interactions, alongside likes and comments. Here’s how they moved from Q2 to Q3.

  • Worldwide per post: The median brand post earned two shares, two saves and one repost in both Q2 and Q3.
  • US per post: The median brand post earned one share, zero saves and zero reposts in both quarters, so the typical US post does not yet get a save or a repost.
  • Reposts: The worldwide median moved from zero to one in March 2026 and has stayed there every month since, seven months after Instagram launched reposts on Aug. 6, 2025.
  • Shares relative to accounts reached: up 52% year over year worldwide and down 7% from Q2. In the US, down 25% year over year and down 5% from Q2.
  • Saves relative to accounts reached: down 10% year over year worldwide and down 8% from Q2.

Shares are the No. 2 interaction behind likes

The Q3 2026 interaction mix is a first-quarter snapshot, so there is no Q2 figure to compare it with. On every format and in both regions, shares are the second-largest interaction type after likes. On Reels and carousels, shares outnumber comments by two to one or more.

  • Reels: shares are 9.7% of interactions worldwide and in the US, against 3.8% and 3.6% for comments
  • Carousels: 7.6% shares and 3.7% comments worldwide; 8.0% and 3.5% in the US
  • Images: 8.0% shares and 5.5% comments worldwide; 8.6% and 4.8% in the US

Likes still make up between 78% and 83% of interactions on each format.

Shares make up more of the interactions on high-reach posts

Posts in the highest reach group get more of their interactions from shares. Worldwide, shares are 7.1% of interactions in the lowest reach group and 12.4% in the highest. In the US, the split is 7.5% and 12.2%. Likes move the other way, from 81.7% to 74.7% worldwide.

Actionable insight: Write for the send. Shares make up a bigger part of interactions on the posts that reach the most people, and Instagram recommends reposts to the reposter’s friends and followers. Track shares per post next to likes and comments, and study your highest-reach posts to see what people pass on.

Impressions per post fell across every network Emplifi tracks

The engagement gains came as brand posts reached fewer people than in Q3 2025 on every network, a global downward trend across platforms. Median impressions per brand post in Q3 2026:

  • Instagram: 2,309 worldwide (down 48% from 4,451 in Q3 2025, up 6% from 2,170 in Q2) and 865 in the US (down 59% from 2,099, down 4% from 898 in Q2)
  • Facebook: 968 worldwide (down 36% from 1,507 in Q3 2025, down 26% from 1,313 in Q2) and 189 in the US (down 26% from 254, down 30% from 269 in Q2)
  • TikTok: 2,709 worldwide (down 60% from 6,747 in Q3 2025). The data has no US TikTok series.

The timing differs by network. Instagram’s decline came between Q3 2025 and Q2 2026, and the worldwide median has stayed between 2,050 and 2,340 impressions every month since February 2026. Facebook kept declining through Q3. Worldwide impressions per post reached 779 in September 2026, about half the 1,507 of July 2025.

Interaction is moving into private sharing

The impression decline comes as more brand conversation moves into private channels that public impression counts do not show. Emplifi’s 2026 report The dark social shift found inbound DMs rose 76% year over year as buyer conversations moved private. Sends matter to Instagram too: its head, Adam Mosseri, names sends among the three signals that matter most for ranking, alongside watch time and likes.

Emplifi’s Instagram data points the same way. Shares relative to accounts reached rose 52% year over year worldwide, though they fell 25% in the US. Shares rank second behind likes, and they make up 12.4% of interactions on the highest-reach posts against 7.1% on the lowest. Instagram reports shares as one count, so the data does not show how many went to DMs.

Actionable insight: Make posts worth sending, and judge them by what they earn per view: track shares and engagement rate per impression next to likes and comments. Put trackable links with UTM tags in your bio, Stories and DM replies so private sharing shows up in your analytics.

US vs worldwide: US Instagram engagement now matches worldwide

US and worldwide medians moved in the same direction on most metrics. Three points stand out:

  • US Instagram engagement rate has caught up: 1.51% in the US is now level with 1.52% worldwide, after nearly doubling in a year.
  • US reach starts lower: 189 median Facebook impressions per post, against 968 worldwide, and 865 on Instagram, against 2,309.
  • US media costs more and clicks better: US CPM of $6.96 is about 3.6 times the worldwide median of $1.94, and US CTR of 2.05% compares with 1.24% worldwide.

Organic benchmarks per brand post, United States and worldwide (quarter medians)

Metric Region Q3 2025 Q2 2026 Q3 2026 Y/Y
Instagram impressions Worldwide 4,450.5 2,170 2,309 -48%
Instagram impressions US 2,099 898 865 -59%
Instagram interactions Worldwide 35 34 34 -3%
Instagram interactions US 30 28 29 -3%
Instagram engagement rate Worldwide 0.91% 1.58% 1.52% +68%
Instagram engagement rate US 0.76% 1.38% 1.51% +97%
Facebook impressions Worldwide 1,506.5 1,313 967.5 -36%
Facebook impressions US 254 269 189 -26%
Facebook engagement rate Worldwide 0.48% 0.48% 0.49% +1%
Facebook engagement rate US 0.39% 0.42% 0.36% -10%
TikTok impressions Worldwide 6,747 3,503 2,709 -60%
TikTok engagement rate Worldwide 1.61% 1.84% 1.94% +20%

Y/Y compares Q3 2026 with Q3 2025. No US TikTok series is available. Engagement rate is interactions divided by impressions for every quarter shown.

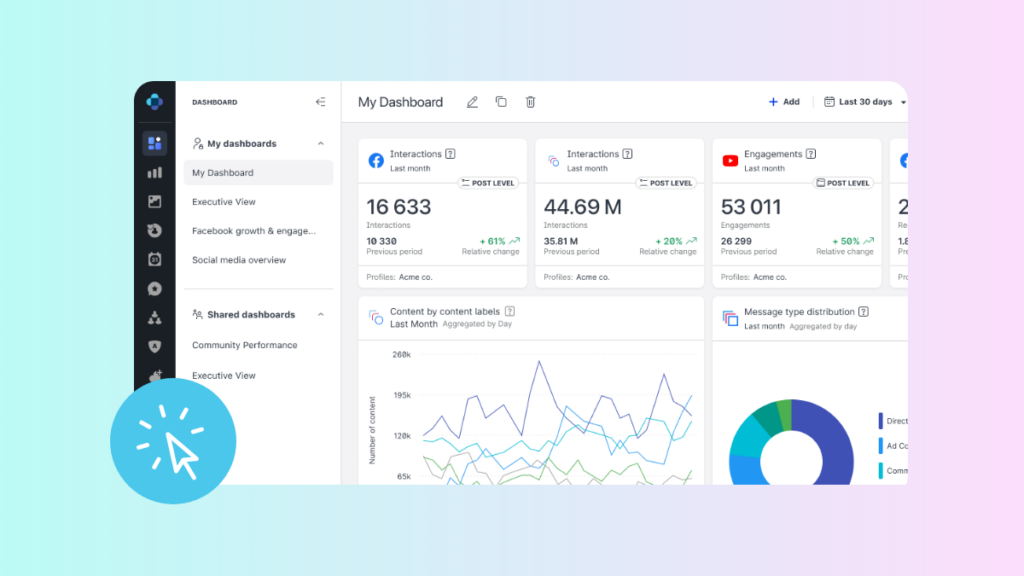
To see where your own profiles land against these medians, Competitive Benchmarking in Emplifi Unified Analytics compares your performance with competitors and industry peers. Take the interactive tour below.

Carousels and Reels lead Instagram interactions

  • Instagram interactions by format: carousels earned 39 median interactions, Reels 38 and images 22 worldwide; in the US, 37, 34 and 16
  • Post mix: carousels rose from 27.5% of worldwide brand posts in September 2025 to 30.7% in September 2026, while images fell from 30.7% to 27.3% and Reels held near 41%. In the US, carousels rose from 25.4% to 27.6% and images fell from 35.3% to 31.8%.
  • Facebook: live video earned 21 median interactions worldwide and 15 in the US, against five or fewer for every other format worldwide. It accounts for under 0.3% of brand posts.

Actionable insight: Carousels and Reels earn close to twice the interactions of single images worldwide, and more than twice in the US. Brands are already moving toward carousels. Make Reels the format you design for sharing, since shares make up 9.7% of their interactions, the highest of any format, and save live video for moments that deserve it.

Paid social: US click-through rate up 30%, with CPM highest in September

  • US click-through rate (CTR): 2.05% in Q3, up 30% from 1.58% in Q3 2025. September reached 2.09%, the highest month in the 15-month window.
  • Worldwide CTR: 1.24%, up 25% from 0.99% in Q3 2025, with September at 1.28%, also the highest month in the window
  • US CPM: $6.96, up 15% from $6.06 in Q3 2025. September reached $8.53, the highest month in the window.
  • Worldwide CPM: $1.94, up 5% year over year

Paid audiences clicked more often while organic impressions per post fell. For placement-level detail from the previous quarter, see our social media ads benchmarks for 2026.

Actionable insight: Put paid budget behind posts that have already proven themselves organically, especially those that earn shares at low reach. For US campaigns, plan around September’s $8.53 CPM as well as the quarter median.

UGC lifts conversion 11.49x on average

Brands using Emplifi’s UGC solution saw these uplifts in Q3 2026, averaged across Emplifi UGC customers in the Worldwide brands benchmark:

  • 11.49x conversion rate
  • 4.84x repeat website visits
  • 2.25x time on site
  • 1.03x average order value

The same figures apply to US brands. They are not comparable with UGC figures from earlier quarters, which were calculated on a different basis.

Actionable insight: When each post reaches fewer people, put user-generated content where buyers decide: product pages, retargeting ads and carousels.

What social teams should do in Q4 2026

Start with your KPIs. Swap reach targets for engagement rate per impression, and restate past rates on the new definition before you compare them.

Then update your reports. Shares, saves and reposts now count as Instagram interactions, so give each one its own column next to likes and comments.

Last, benchmark by segment. US and worldwide numbers differ sharply on Facebook, so check the medians for your own industry and region on Emplifi’s industry benchmarks page.

Methodology: Emplifi analyzed anonymized organic posts from 167,493 Facebook pages, 77,038 Instagram profiles and 1,301 TikTok profiles in its Worldwide brands benchmark, including 23,144 Facebook pages and 11,515 Instagram profiles in the United States, plus Meta ad accounts for paid metrics. Figures are medians per post or per ad account; UGC uplifts are averages. Each quarter’s value is the median of its three monthly values, so it can differ from the quarter-end month figures on Emplifi’s industry benchmark pages. Engagement rate is interactions divided by impressions for every period shown and is not comparable with engagement rates in earlier Emplifi reports.

Frequently asked questions

They are Emplifi’s medians for brand posts on Facebook, Instagram and TikTok from July to September 2026, compared with Q2 2026 and Q3 2025, plus Meta ads CTR and CPM. Industry and regional editions are on Emplifi’s industry benchmarks page.

Impressions per brand post fell on every network Emplifi tracks over the past year: 48% on Instagram, 36% on Facebook and 60% on TikTok worldwide. The decline comes as more sharing moves into private channels such as DMs, which public impression counts do not show; Emplifi’s dark social research found inbound DMs rose 76% year over year. On Instagram, interactions held steady, so engagement rate per impression rose.

Engagement rate is interactions divided by impressions. Emplifi changed from a reach-based rate because Facebook no longer provides reach data, and every quarter in this piece uses the new definition. These rates are not comparable with engagement rates in earlier Emplifi reports. Read more about social media engagement.

From Q3 2026, Instagram interactions count saves, shares and reposts alongside likes and comments. The median worldwide brand post earned two shares, two saves and one repost in Q3, the same as in Q2. The median US post earned one share and no saves or reposts. Here’s how reposting on Instagram works.

Carousels, with 39 median interactions worldwide and 37 in the US, just ahead of Reels at 38 and 34. Images earned 22 and 16.

US Facebook posts earned 189 median impressions against 968 worldwide, and US Instagram posts 865 against 2,309. US Instagram engagement rate, at 1.51%, is now level with 1.52% worldwide. For the full-year view, see Emplifi’s 2026 social media benchmarks.

Set your Q3 2026 median impressions, interactions and engagement rate per platform against the figures above. Emplifi’s free social media assessment runs that comparison for you.

Ready to fuel your teams with A-CX?

Discover what Emplifi can do for you. We turn small teams into large ones, and large teams into well oiled machines, but either way, we offer the rocket ship, you just need to jump on.

What can you expect?

  • A live walkthrough of Emplifi Fuel tailored to your specific social marketing, commerce, and care needs
  • A benchmark of how your brand performs against peers in your industry
  • A partner who understands your business, and 22,000 others
  • A concrete action plan to go from disjointed teams to A-CX
Get a demo