2026 Gartner® Magic Quadrant™

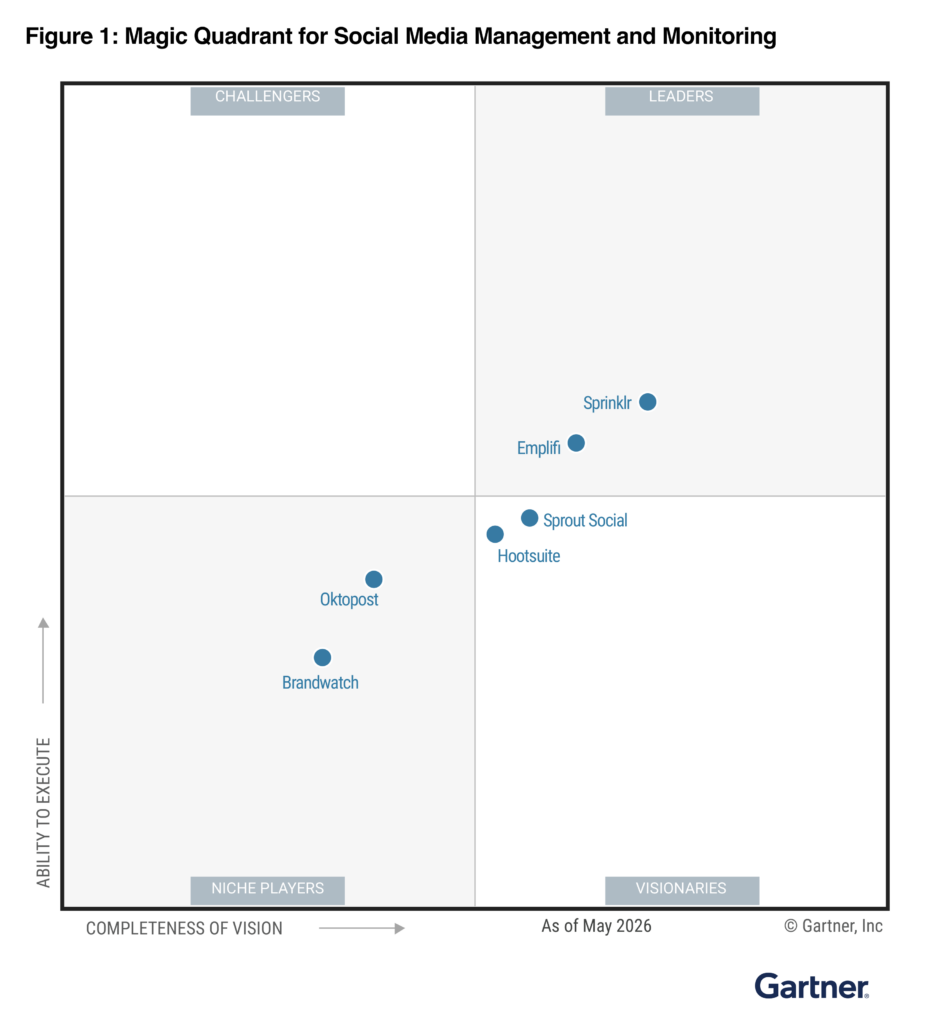
Emplifi named a Leader in the 2026 Gartner® Magic Quadrant™ for Social Media Management and Listening

Get the Report

Emplifi named a Leader in the 2026 Gartner® Magic Quadrant™ for Social Media Management and Listening Get the Report

Blog
8 min read
Jul 17, 2026

The Agentic AI measurement playbook: KPIs, dashboards, and the metrics that actually matter

Agentic AI needs its own KPI framework across five categories: containment and resolution, time and efficiency, quality and accuracy, commercial impact, and team and governance health, measured against a baseline captured before go-live.

Gabriel Tay Director of Business Consulting at Emplifi
Women in office looking at screen that shows VOC workflow

Key points:

  • Traditional social and care KPIs measure activity and effort, not the outcomes Agentic AI is actually built to deliver
  • Five KPI categories cover the full picture: containment, time and efficiency, quality, commercial impact, and governance
  • A credible ROI story starts with a pre-deployment baseline, not a post-launch dashboard
  • A platform like Emplifi, with built-in audit logging and pre-LLM redaction turns governance reporting into a pull, not a manual reconstruction after the fact

Your Agentic AI deployment is live. Cases are being handled, response times are down, the team seems relieved. Then the CFO asks what the ROI actually is, and the answer on the table is a handful of engagement metrics that don’t mean anything in a board conversation.

The issue is that Agentic AI doesn’t behave like a social channel, and it doesn’t behave like a traditional contact center either, so it needs its own measurement layer.

One that captures containment, accuracy, time compression, and commercial impact at the same time, in language a finance team will actually accept.

In this guide, you’ll learn:

  • Why the metrics you already track won’t hold up in a board conversation about Agentic AI
  • The five KPI categories that give a complete, defensible measurement picture
  • What to put on a daily dashboard versus a quarterly board report
  • How to set a baseline before you deploy, so the after-numbers actually mean something

Why don’t traditional KPIs work for Agentic AI?

Social media metrics measure activity such as engagement rate, follower growth, and impressions. They tell you whether people are showing up and interacting with your content, rather than whether a problem got solved.

On the same score, traditional care metrics measure effort. CSAT and NPS capture how a customer feels about an interaction, but they were built for a world where every case had a human on the other end, working at human speed.

This gap matters more once care, marketing, and commerce start running through the same Autonomous CX platform, since a single case can touch all three at once.

AI changing social care

Trending insight: Digital Authenticity in the Age of AI

See what 1,650 consumers say about brand responsiveness, AI transparency, and what actually builds trust in customer care.

Download now

Agentic AI sits between the two and needs to be measured on both outcomes and efficiency at once. A case can be resolved fast and still be resolved badly.

For example, a high CSAT score can mask a low containment rate if a human cleaned up the mess afterward. Neither traditional lens catches that on its own.

This isn’t a case for throwing out what you already track. It’s a case for adding a layer built specifically for how Agentic AI actually operates: autonomously, at scale, across care, commerce, and marketing simultaneously.

What are the five KPI categories that actually matter?

Each one answers a different question a CFO, an ops lead, or a compliance officer will actually ask. They are:

1. Containment and resolution

This is the foundation. If your Agentic AI isn’t actually closing cases, nothing else in this list matters yet.

Focus on:

  • Containment rate: The percentage of cases fully resolved by the agent with no human escalation
  • First contact resolution rate: Cases closed on the first interaction, no follow-up required
  • Deflection rate: Volume shifted away from higher-cost channels like phone support

Containment rate should be your North Star metric here, but expect it to move. It starts low and climbs as the model learns your specific case mix, so baseline it before go-live rather than judging month one against a mature deployment.

2. Time and efficiency

This is where Agentic AI earns its keep on paper, and where you’ll want hard numbers rather than estimates.

You should measure:

  • Time to first response: How long a customer waits before hearing back at all, the number that shapes their first impression of the interaction
  • Average handle time: The total working time a case takes from open to close, the core efficiency measure Agentic AI is built to shrink
  • Time to resolution: The full elapsed time a customer experiences, including any wait between touches, not just the time an agent is actively working on it
  • Automation lift: The specific reduction in handling time versus human-only workflows

3. Quality and accuracy

Speed without accuracy just moves the problem faster. This category keeps the first two honest.

You should measure:

  • Agent accuracy rate: Measured in shadow mode before go-live so you have a clean baseline before the system touches a live customer
  • Sentiment score on AI-handled cases versus human-handled cases: So you can see if resolution speed is coming at the cost of how the interaction actually felt
  • Escalation rate: The percentage of AI cases that require human intervention. A falling escalation rate over time is one of the clearest signals that the model is actually improving

Accuracy rate and escalation rate answer different questions:

  • Accuracy tells you whether the response was correct
  • Escalation tells you whether the system knew when it wasn’t equipped to handle something on its own

You need both numbers, not one standing in for the other.

4. Commercial impact

For any deployment connected to commerce, this is the category that turns a CX initiative into a revenue conversation.

Here, you should zero in on:

  • Post-to-cart attribution rate: The share of Agentic AI interactions, like a product question or comment reply, that lead directly to an added-to-cart action, the metric that ties a care or marketing conversation to commerce
  • AOV on AI-assisted versus non-assisted transactions: Whether purchases that touched an Agentic AI interaction are worth more than the ones that didn’t, a signal of whether the AI is upselling or just answering
  • Repeat purchase rate: For customers who received an Agentic AI resolution, whether a good resolution turns into loyalty, not just a one-time fix

Emplifi’s social commerce clients collectively generate close to $8 billion in annual revenue tied to UGC (User-Generated Content), which gives you a sense of scale for what a well-connected care-to-commerce pipeline can be worth.

Carhartt, for its part, has driven over 85,000 customer interactions through its UGC program with Emplifi. You should use figures like these as context for what’s possible, not as a stand-in for your own baseline numbers.

Before Emplifi, we were limited in how we could showcase our customers’ voices. Now, their stories define Carhartt in a way that no campaign ever could.
Kaleena Ocasio
D2C Digital Content Specialist at Carhartt Inc

5. Team and governance health

This is the category IT, compliance, and operations leaders will look for first, and it’s easy to skip if you’re only thinking about care metrics.

  • Agent utilization rate: How much human agent time is going to Tier 2 and Tier 3 work (complex or escalated cases) versus getting pulled into Tier 1 volume (routine, high-volume cases an agent shouldn’t need to touch)
  • Audit trail coverage rate: The percentage of autonomous cases with a complete, retrievable log of what the agent decided and why
  • Policy compliance rate: The percentage of autonomous actions that stayed inside approved guardrails

A platform like Emplifi, with built-in audit logging and Pre-LLM redaction of sensitive data, makes this category far easier to report on, since compliance can pull a clean trail instead of reconstructing one after the fact.

This is also the category to lean on if you’re building out governed agentic AI workflows for a regulated industry, where the guardrails need to be provable, not just present.

What should you report at each level of the measurement dashboard?

Not every metric belongs in every meeting, so use this table to match the report to the audience:

Reporting view Audience What to include
Daily operational dashboard Care team supervisors Containment rate, escalation rate, time to first response, active case volume by tier
Weekly management report CX and social leaders Resolution rates, sentiment trends, accuracy rate, team utilization by tier, commerce attribution summary
Quarterly board report CX and marketing leadership Cost-per-resolution trend, revenue attributed to Agentic workflows, containment rate trajectory versus pre-deployment baseline

The daily view is operational and reactive, whereas the weekly view is about trend-spotting.

The quarterly view is the only one that needs to survive a conversation with the CFO, so it’s the one to build first, even if you won’t present it for three months.

How do you set your baseline before deploying?

None of the numbers above mean anything without a “before” to compare them to.

Before go-live, capture:

  • Handle time: How long, on average, your team spends per case today, before any of it touches Agentic AI
  • Containment rate: Even if that just means first contact resolution today, since you likely don’t have a true containment number yet
  • CSAT: Your current satisfaction score, so you have something concrete to compare AI-handled cases against later
  • Cost-per-resolution: What each case costs you now in agent time, so the ROI math has a real starting point instead of an estimate

Gartner estimates a self-service interaction costs around $1.84, versus $13.50 for an assisted one. Useful external anchor if your own historical cost data is thin.

Trending insight: The State of Social Media Marketing 2026 report

82% of marketers say AI has improved productivity. See what's separating the ones getting real results from everyone else.

Download now

And two real deployments show what a strong baseline looks like when you use AI to speed up CX processes:

  • Domino’s brought case handling time down 53%
  • Salomon cut response time 45%, with human agents working inside a well-organized Emplifi platform

That’s the bar a mature, human-run operation can already hit. It’s exactly the baseline agentic AI needs to beat, not a low bar it’s competing with.

Write these numbers down somewhere the whole team can see them. Three months from now, when someone asks whether the deployment is actually working, you want a real number to point to, not a memory of how things used to feel.

What consumers actually expect from AI

83% want disclosure when AI is involved. 71% say they’re satisfied with AI support. See the full picture of how consumer expectations around AI are shifting.

Final thoughts: Measurement is the business case

A dashboard full of engagement metrics won’t survive a budget conversation. A dashboard built around containment, efficiency, accuracy, commercial impact, and governance will.

Measure it right from day one, and the ROI conversation with the CFO stops being a defense and starts being a plan.

Stop reporting activity. Start proving outcomes. Request an Emplifi measurement consultation to see exactly how your Agentic AI deployment should be tracked, from day one through the board report.

Frequently asked questions

Expect containment rate and accuracy to be noticeably lower in month one than in month six. The model is learning your specific case mix, product catalog, and tone. Most teams see meaningful stabilization by the 90-day mark, which is why the pre-deployment baseline matters so much for setting realistic early expectations.

Containment rate measures cases the AI resolved fully on its own, no human involved. Deflection rate measures volume that moved away from a more expensive channel, like phone, regardless of whether a human or the AI ultimately handled it. A case can count toward deflection without counting toward containment.

It requires infrastructure that can track cases across tiers, log AI decisions and escalations, and connect care data to commerce outcomes where relevant. A platform with built-in audit trail coverage and unified analytics across care and commerce removes most of the manual reconciliation work this would otherwise take.

Lead with cost-per-resolution trend and revenue attributed to Agentic workflows, benchmarked against your pre-deployment baseline. Avoid vanity metrics like volume of cases handled in isolation. Gartner’s industry figures on self-service versus assisted cost-per-contact are useful supporting context, but your own baseline will carry the most weight in the room.