2026 Gartner® Magic Quadrant™

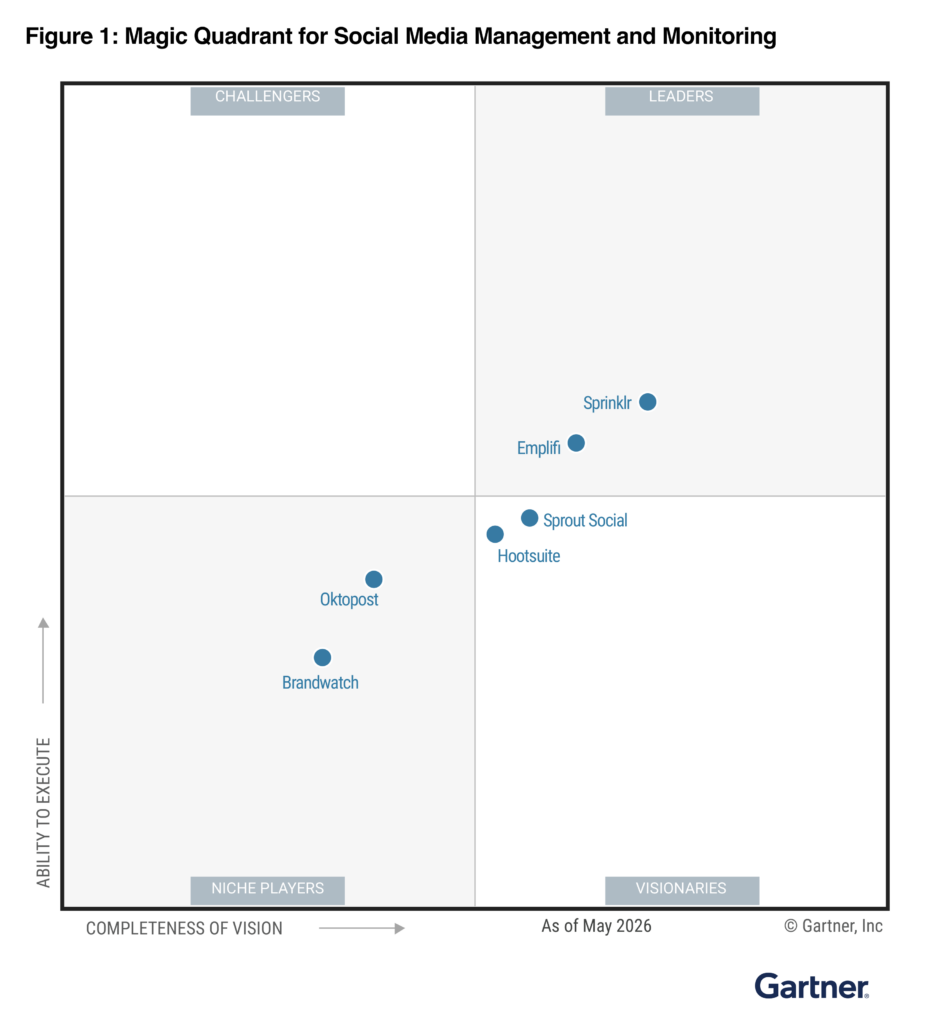
Emplifi named a Leader in the 2026 Gartner® Magic Quadrant™ for Social Media Management and Listening

Get the Report

Emplifi named a Leader in the 2026 Gartner® Magic Quadrant™ for Social Media Management and Listening Get the Report

Blog
13 min read
Jul 22, 2026

Worldwide Social Media Benchmarks: Clothing Q2 2026

Emplifi Team Social Media Marketing Experts

What’s in this report

In Q2 2026, Worldwide clothing brands saw median Instagram engagement rates of around 2.0%, more than double Facebook’s roughly 0.95%. Instagram also led on activity volume and reach for the category. Carousels and Reels remained the top-performing organic post types on Instagram, while Live Video dominated on Facebook, and Ecommerce brands captured the largest share of total interactions on both platforms.

This quarterly benchmarks report pulls from Emplifi’s dataset of 5,794 Facebook pages and 4,412 Instagram profiles across Worldwide, covering April 1, 2026 through June 30, 2026.

User-generated content: what’s achievable

Brands using Emplifi’s UGC solution this quarter saw:

  • 8.02x increase in conversion rate
  • 4.31x increase in website visits
  • 1.01x increase in average order value

These figures represent the median uplift seen across Emplifi’s Fashion UGC Accounts Benchmark for Q2 2026.

Organic performance: Facebook and Instagram

Interaction share by industry

On Facebook, Ecommerce accounts for 27.5% of total brand interactions — the highest share of any category. On Instagram, Ecommerce leads with 37.4% of interactions. Clothing itself is a smaller slice of the overall pie on both platforms: Clothing brands account for 4.4% of total Facebook brand-page interactions and 11.8% of total Instagram brand-profile interactions Worldwide (reported there under the Fashion category).

Facebook interaction distribution (Q2 2026):

Category Share of total interactions
Ecommerce 27.5%
Retail 11.5%
Services 10.8%
Finance 6.1%
Electronics 5.8%
Others 26.3%

Instagram interaction distribution (Q2 2026):

Category Share of total interactions
Ecommerce 37.4%
Fashion 11.8%
Services 6.7%
Retail 6.4%
Sporting Goods 6.2%
Others 18.6%

Platform landscape at a glance

In Worldwide, Instagram Clothing profiles carry a higher median follower count than Facebook pages carry in fans. The figures below reflect directional comparisons across all profiles in the sample at the end of Q2 2026 (Emplifi’s landscape view for this slide is presented as relative circle sizes rather than printed values).

Metric Instagram Facebook
Median followers / fans Higher Lower
Median posts published (quarter) Higher Lower
Median total interactions (quarter) Higher Lower

Activity volume on both platforms is higher on Instagram, while user engagement on Instagram also outpaces Facebook — reinforcing Instagram as the more important channel for Clothing marketers this quarter.

Median post interactions

Median post interactions track the middle-ranked page or profile by monthly interactions — a measure of typical performance rather than outlier peaks.

Platform Q2 2026 median post interactions
Instagram ~38
Facebook ~7

Instagram median post interactions declined from a peak of around 51 in May 2025 to the high-30s by mid-2026, holding fairly steady in that range since late 2025. Facebook median post interactions stayed flat throughout the period, hovering between 6 and 9.

Relative median post interactions

Relative median interactions index each platform’s performance against its own peak over the reporting period, making it easier to compare directional trends across platforms regardless of absolute scale.

By Q2 2026, Instagram’s relative median interactions sat around 75-78% of its 12-month peak, having dropped early (by mid-2025) and stayed roughly flat since. Facebook held close to its own peak (100%) until early 2026, then fell to a similar 78-80% level — converging with Instagram’s relative position by the end of the period.

Median post impressions

Impressions measure how many times posts were displayed, regardless of interaction. This metric is available for both platforms and reflects reach rather than engagement.

Platform Q2 2026 median post impressions
Instagram ~9,300
Facebook ~3,200

Instagram impressions climbed sharply through 2025, peaking near 22,000 in September before pulling back to the 8,000-9,500 range through Q1 and Q2 2026 — likely reflecting algorithmic reach patterns tied to Reels distribution. Facebook impressions stayed low and flat, in the 3,000-5,000 range, for the full period.

Engagement rate trends

Median post engagement rates this quarter:

  • Instagram: ~2.05%
  • Facebook: ~0.95%

Instagram engagement held broadly steady in the 1.8-2.1% range across the past year. Facebook engagement trended gradually upward, climbing from around 0.50% in mid-2025 to nearly 1.00% by Q2 2026.

Best-performing post types

Facebook: Live Video and standard Video continue to outperform other formats organically. In Q2 2026, Live Video generated a median of 36 post interactions, while standard Video reached 4.

Instagram: Carousel and Reel posts lead organic performance. Carousels generated a median of 48 post interactions this quarter; Reels reached 39.

Full organic post type performance (Q2 2026):

Post type Platform Median post interactions
Live Video Facebook 36
Video Facebook 4
Photo Facebook 6
Reel Facebook 7
Status Facebook 5
Link Facebook 10
Carousel Instagram 48
Reel Instagram 39
Image Instagram 28

Post type distribution trends:

On Facebook, Photo remains the dominant post format at around 65% of posts, though Reels are gaining share steadily — rising from near zero earlier in the year to approximately 25% by Q2 2026. On Instagram, Carousel, Reel, and Image each account for roughly a third of posts published, with Carousel and Reel driving the majority of top-performing content.

Top performing pages and profiles

Facebook — top pages by total interactions (Q2 2026):

Rank Brand Posts Interactions
1 Sabri-Parisien ou rien 895 873,604
2 Luckless Outfitters 432 740,890
3 Linh Nga Couture 347 702,214

Instagram — top profiles by total interactions (Q2 2026):

Rank Brand Followers Posts Interactions
1 Victoria’s Secret 76,940,635 145 7,826,965
2 SHEIN.COM 41,010,327 540 7,599,553
3 Leandro Lopes 157,364 189 3,691,055

Top posts this quarter

The highest-performing individual posts by interactions across Worldwide brands in Q2 2026:

Facebook:

Rank Brand Post description Interactions
1 Máscara De Látex Product/lifestyle photo post 497,059
2 Amparo Zepeda Car giveaway/promo post 442,109
3 ThirdLove Email signup/lifestyle post 169,987

Instagram:

Rank Brand Post description Interactions
1 Levi’s Stadium/venue announcement post 2,589,558
2 MESHKI Product/dress promo post 1,601,623
3 Kith Adidas football collab post 1,419,980

How does your brand compare?

These benchmarks reflect median performance across thousands of brands in Emplifi’s dataset. Get a free personalized assessment to see exactly where your brand stands today.

Get your free social media assessment →

How to use these benchmarks

These figures represent median performance across thousands of brand profiles in Emplifi’s dataset — they’re a useful calibration point, not a ceiling. If your Instagram engagement rate is sitting above 2.0%, you’re already ahead of the median for Worldwide clothing brands; below it, shifting more of your content mix toward Carousels and Reels is likely worth testing.

Get your personalized social media assessment

These benchmarks tell you what’s typical across the industry. A personalized assessment tells you how your brand is actually performing against peers.

Get a free social media assessment →

Frequently asked questions

Instagram. Across 30 industries, Instagram posts got higher user engagement than Facebook posts — with no exceptions. Instagram also led on activity volume (post frequency) in most verticals, and ran neck-and-neck with Facebook in the rest. If you’re deciding where to focus organic effort this quarter, Instagram is the stronger channel almost everywhere.

Reels and carousels. In nearly every industry we benchmarked, these two formats drove the highest median post interactions, often by a wide margin over photos and stories. Which one wins first place varies by industry, but the reel-carousel pairing is the consistent pattern.

The Facebook feed. It had the lowest cost per click worldwide, with Facebook Reels close behind as the second-cheapest placement. Instagram Stories was the lowest-CPC Instagram placement, but still came in behind both Facebook options.

E-commerce, by a wide margin — accounting for 37.4% of all brand-profile interactions on Instagram and 27.5% on Facebook. Retail and services follow as the next-largest categories on both platforms, with fashion also ranking high on Instagram specifically.

Brands using UGC saw a 19.88x increase in conversion rate, a 5.06x increase in website visits, and a 1.08x increase in average order value, compared to brands that don’t (Emplifi Brands UGC benchmark, Q2 2026). Conversion rate is where UGC makes the biggest difference.

Ready to fuel your teams with A-CX?

Discover what Emplifi can do for you. We turn small teams into large ones, and large teams into well oiled machines, but either way, we offer the rocket ship, you just need to jump on.

What can you expect?

  • A live walkthrough of Emplifi Fuel tailored to your specific social marketing, commerce, and care needs
  • A benchmark of how your brand performs against peers in your industry
  • A partner who understands your business, and 22,000 others
  • A concrete action plan to go from disjointed teams to A-CX
Get a demo