2026 Gartner® Magic Quadrant™

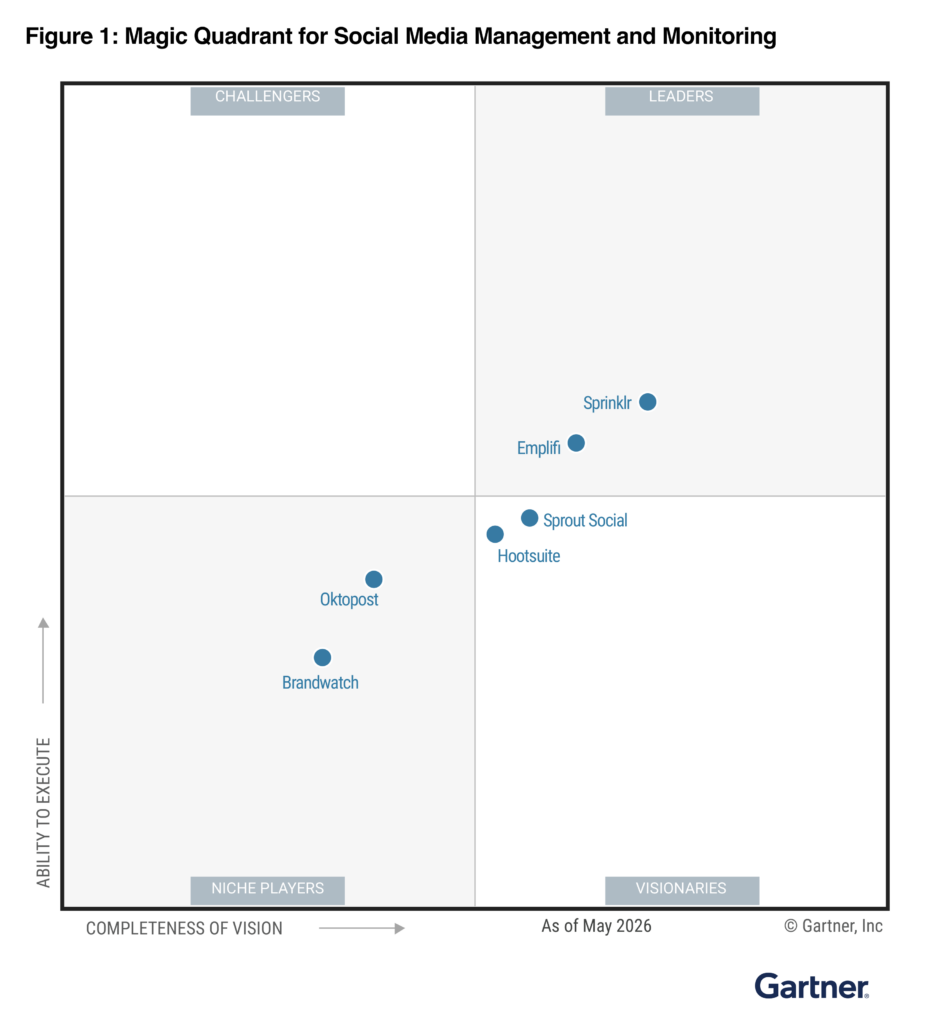
Emplifi named a Leader in the 2026 Gartner® Magic Quadrant™ for Social Media Management and Listening

Get the Report

Emplifi named a Leader in the 2026 Gartner® Magic Quadrant™ for Social Media Management and Listening Get the Report

Blog
13 min read
Jul 22, 2026

Worldwide Social Media Benchmarks: Confectionery Q2 2026

Emplifi Team Social Media Marketing Experts

What’s in this report

In Q2 2026, Confectionery brands on Instagram saw median post engagement rates of around 3.9%, dwarfing Facebook’s roughly 0.75%. Facebook’s Live Video format still delivers the strongest organic results by a wide margin, while Carousel and Reel posts lead the way on Instagram. On the paid side, Confectionery advertisers pay a premium for clicks compared to the Worldwide average but get a notably cheaper cost per thousand impressions.

This quarterly benchmarks report pulls from Emplifi’s dataset of 2,742 Facebook pages and 1,528 Instagram profiles across Worldwide, covering April 1, 2026 through June 30, 2026.

User-generated content: what’s achievable

Brands using Emplifi’s UGC solution this quarter saw:

  • 19.88x increase in conversion rate
  • 5.06x increase in website visits
  • 1.08x increase in average order value

These figures represent the median uplift seen across Emplifi’s Brands UGC Accounts Benchmark for Q2 2026.

Organic performance: Facebook and Instagram

Interaction share by industry

On Facebook, Ecommerce accounts for 27.5% of total brand interactions — the highest share of any category. On Instagram, Ecommerce also leads with 37.4% of interactions. Within Confectionery specifically, the category is a modest slice of the total interaction pie Worldwide — roughly 3.8% of Facebook brand-page interactions and 1.7% of Instagram brand-profile interactions — reflecting the fact that Confectionery competes for attention against much larger categories like Ecommerce and Retail.

Facebook interaction distribution (Q2 2026):

Category Share of total interactions
Ecommerce 27.5%
Retail 11.5%
Services 10.8%
Finance 6.1%
Electronics 5.8%
Others 26.3%

Instagram interaction distribution (Q2 2026):

Category Share of total interactions
Ecommerce 37.4%
Fashion 11.8%
Services 6.7%
Retail 6.4%
Sporting Goods 6.2%
Others 18.6%

Platform landscape at a glance

In Worldwide, Confectionery’s Facebook pages carry a higher median fan count than Instagram profiles carry followers — the reverse of what’s typical in many other industries. The figures below reflect directional comparisons across all profiles in the sample at the end of Q2 2026 (the underlying chart doesn’t showcase exact medians, so directional comparisons are shown).

Metric Instagram Facebook
Median followers / fans Lower Higher
Median posts published (quarter) Higher Lower
Median total interactions (quarter) Higher Lower

Activity volume is higher on Instagram than on Facebook for Confectionery brands, and user engagement on Instagram outpaces Facebook as well — despite Instagram profiles typically carrying a smaller audience base.

Median post interactions

Median post interactions track the middle-ranked page or profile by monthly interactions — a measure of typical performance rather than outlier peaks.

Platform Q2 2026 median post interactions
Instagram ~45
Facebook ~11

Instagram median post interactions declined steadily over the past year, from around 60 in May 2025 to the mid-40s by Q2 2026. Facebook held in a narrow band of roughly 15-17 for most of the period before slipping to around 10-11 by June 2026.

Relative median post interactions

Relative median interactions index each platform’s performance against its own peak over the reporting period, making it easier to compare directional trends across platforms regardless of absolute scale.

By Q2 2026, Facebook’s relative median interactions had fallen to around 60% of its peak — its lowest point in the period — while Instagram sat modestly higher at around 70% of its own peak, both trending down from levels closer to 90-100% a year earlier.

Median post impressions

Impressions measure how many times posts were displayed, regardless of interaction. This metric is available for both platforms and reflects reach rather than engagement.

Platform Q2 2026 median post impressions
Instagram ~2,000
Facebook ~3,100

Facebook impressions started the period high at around 7,000 in May 2025, dipped through the summer, spiked again to roughly 6,100 in January 2026, then fell to around 3,000-3,200 by Q2 2026. Instagram impressions moved in the opposite direction for most of the year — climbing from about 1,500 to a peak near 4,700 around November 2025 — before pulling back to roughly 1,800-2,300 through Q2 2026.

Engagement rate trends

Median post engagement rates this quarter:

  • Instagram: ~3.9%
  • Facebook: ~0.75%

Instagram engagement has stayed in a fairly tight band of roughly 3.6-4.1% all year, ticking up slightly toward Q2 2026. Facebook engagement has been comparatively flat and low, hovering between 0.5% and 0.8% throughout the period.

Best-performing post types

Facebook: Live Video and standard Video continue to outperform other formats organically. In Q2 2026, Live Video generated a median of 56 post interactions, while standard Video reached only 4.

Instagram: Carousel and Reel posts lead organic performance. Carousels generated a median of 60 post interactions this quarter; Reels reached 44.

Full organic post type performance (Q2 2026):

Post type Platform Median post interactions
Live Video Facebook 56
Video Facebook 4
Photo Facebook 9
Reel Facebook 15
Status Facebook 12
Link Facebook 13
Carousel Instagram 60
Reel Instagram 44
Image Instagram 40

Post type distribution trends:

On Facebook, Photo remains the dominant post format at around 56% of posts in Q2 2026, down from roughly 74% a year earlier, as Reels have climbed from near zero to about 40% of posts over the same period. On Instagram, the mix looks different than in many other categories: Reels lead at around 46-48% of posts, Images follow at roughly 34%, and Carousels are the smallest share at about 15% — yet Carousels and Reels are still the two formats driving the strongest organic engagement.

Top performing pages and profiles

Facebook — top pages by total interactions (Q2 2026):

Rank Brand Posts Interactions
1 Chef JoséRa Castillo 248 676,280
2 Feastables 20 387,081
3 Sticky 137 384,251

Instagram — top profiles by total interactions (Q2 2026):

Rank Brand Followers Posts Interactions
1 OREO 3,832,430 33 5,549,911
2 Baked by Melissa 1,771,047 103 1,425,826
3 Sour Patch Kids 1,063,800 43 1,002,339

Top posts this quarter

The highest-performing individual posts by interactions across Worldwide brands in Q2 2026:

Facebook:

Rank Brand Post description Interactions
1 OREO Playful brand collaboration post 250,505
2 Chef JoséRa Castillo Recipe/personality video post 179,022
3 KitKat Product giveaway/promo post 132,456

Instagram:

Rank Brand Post description Interactions
1 OREO Playful brand collaboration post 3,466,188
2 OREO Product/flavor announcement post 962,563
3 OREO Product launch announcement post 372,788

How does your brand compare?

These benchmarks reflect median performance across thousands of brands in Emplifi’s dataset. Get a free personalized assessment to see exactly where your brand stands today.

Get your free social media assessment →

How to use these benchmarks

These figures represent median performance across thousands of brand profiles in Emplifi’s dataset — they’re a useful calibration point, not a ceiling. If your Confectionery brand’s Instagram engagement rate is above 3.9%, you’re already ahead of the median; if your Facebook ad CPM is well above $1.15, there may be room to shift budget toward more efficient placements like FB feed.

Get your personalized social media assessment

These benchmarks tell you what’s typical across the industry. A personalized assessment tells you how your brand is actually performing against peers.

Get a free social media assessment →

Frequently asked questions

Instagram. Across 30 industries, Instagram posts got higher user engagement than Facebook posts — with no exceptions. Instagram also led on activity volume (post frequency) in most verticals, and ran neck-and-neck with Facebook in the rest. If you’re deciding where to focus organic effort this quarter, Instagram is the stronger channel almost everywhere.

Reels and carousels. In nearly every industry we benchmarked, these two formats drove the highest median post interactions, often by a wide margin over photos and stories. Which one wins first place varies by industry, but the reel-carousel pairing is the consistent pattern.

The Facebook feed. It had the lowest cost per click worldwide, with Facebook Reels close behind as the second-cheapest placement. Instagram Stories was the lowest-CPC Instagram placement, but still came in behind both Facebook options.

E-commerce, by a wide margin — accounting for 37.4% of all brand-profile interactions on Instagram and 27.5% on Facebook. Retail and services follow as the next-largest categories on both platforms, with fashion also ranking high on Instagram specifically.

Brands using UGC saw a 19.88x increase in conversion rate, a 5.06x increase in website visits, and a 1.08x increase in average order value, compared to brands that don’t (Emplifi Brands UGC benchmark, Q2 2026). Conversion rate is where UGC makes the biggest difference.

Ready to fuel your teams with A-CX?

Discover what Emplifi can do for you. We turn small teams into large ones, and large teams into well oiled machines, but either way, we offer the rocket ship, you just need to jump on.

What can you expect?

  • A live walkthrough of Emplifi Fuel tailored to your specific social marketing, commerce, and care needs
  • A benchmark of how your brand performs against peers in your industry
  • A partner who understands your business, and 22,000 others
  • A concrete action plan to go from disjointed teams to A-CX
Get a demo