Editor's Note: This is the 2023 edition of this article. Click here to view the most recent edition of this social media benchmarks article.
As 2023 gets going, it’s never been more important for brands to have a good way to measure their social media performance against their peers. There are so many directions social media teams can get pulled in that it’s nearly impossible to fully gauge success without having a deep understanding of how competitors in the market – both within your specific industry and elsewhere – are doing.
One of the good things about having thousands of active brands leveraging the Emplifi Social Marketing Cloud is that we can look at that data for you. Here, we've gathered that data to give you a comprehensive look at the state of social media marketing as 2023 gets cranked up.
Looking for even more benchmarks to guide your social marketing efforts in 2023? Check out our quarterly Industry Benchmarks reports and get targeted social media insights specific to your industry!
What to know before we dive into these social media benchmarks
They leverage publicly-available metrics of hundreds of thousands of profiles monitored in Emplifi databases, as well as anonymized data from Emplifi clients.
Unless otherwise stated, all benchmarks look at median data — not averages. Calculating averages is ideal with datasets that have a normal distribution. However, social media data hardly ever have a normal distribution, with the majority of the sample performing far from the average. As such, looking at median data addresses this issue.
Benchmarks are only reported when a minimum of 50 active profiles or ad accounts are available, and profiles are never manually excluded.
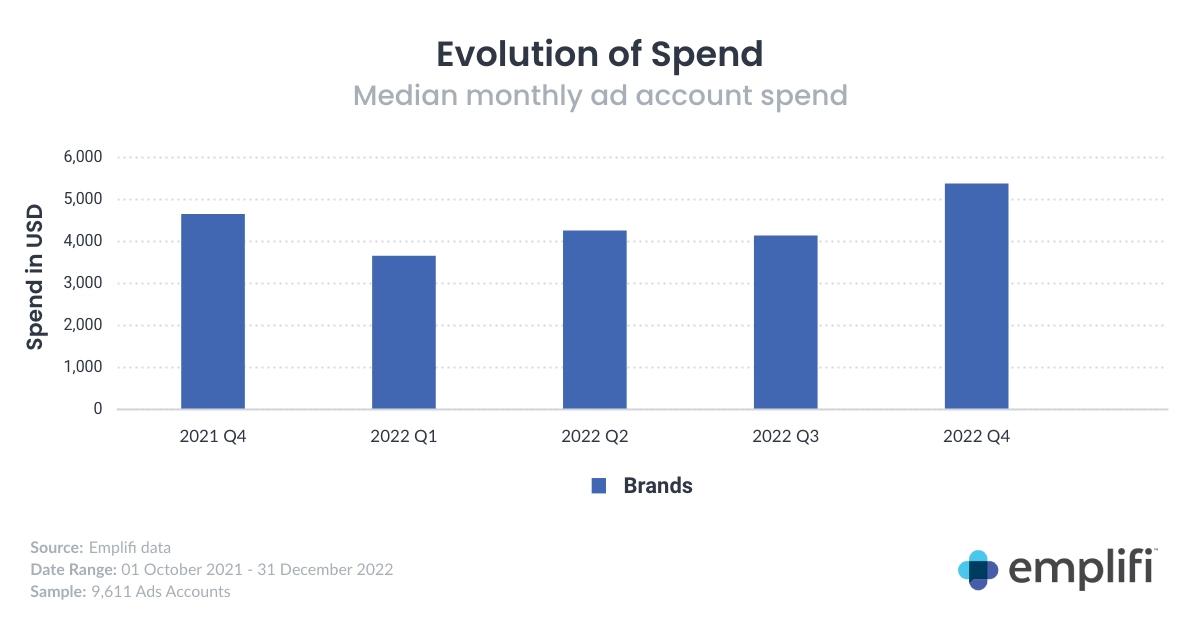
1. Median monthly ad account spend (2022 average): $4,361
Key takeaways
After fluctuating throughout 2022, median monthly ad account spend among Brands increased in Q4 2022 to reach a 15-month-high.
This Q4 spike is consistent with what we’ve seen in previous years during the holiday season. Ad account spend is expected to come back down in Q1 2023, and fluctuate before increasing again in Q4 2023.
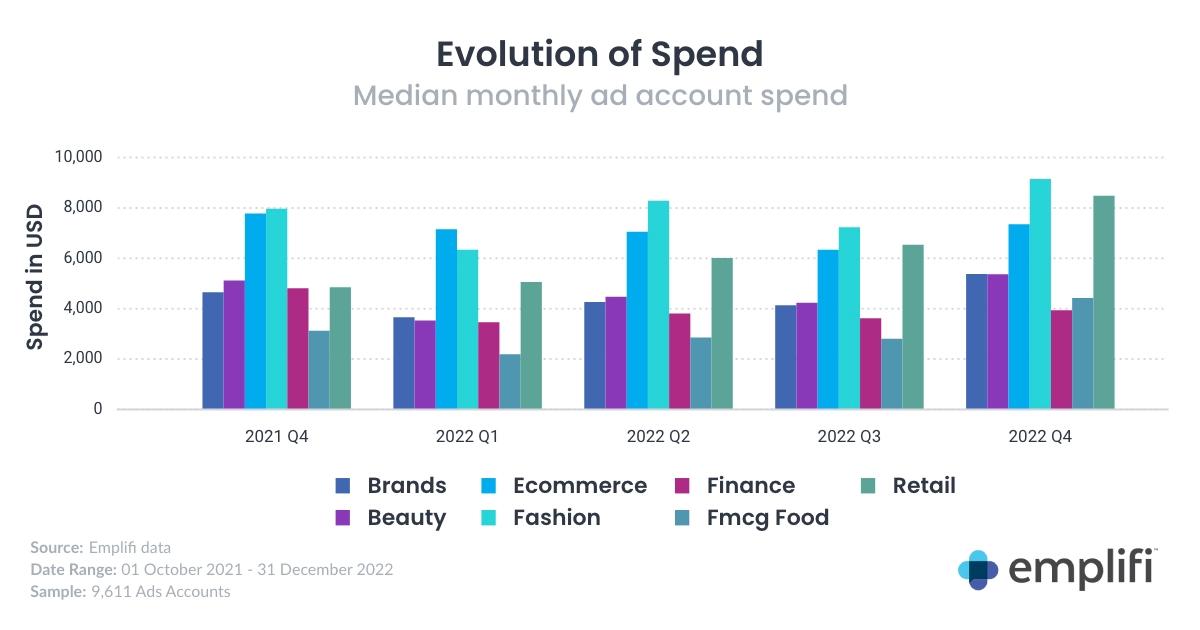
Of the industries examined, a jump in ad account spend among Retail brands significantly contributed to this overall jump.
Analysis
Median monthly ad account spend significantly increased by 36% in Q4 2022 to reach $5,380, also representing a 21% YoY increase.
Retail saw the biggest increase in ad account spend in Q4 2022, with a YoY increase of 75% from $4,848 to $8,481. This sector spent more in Q4 than all sectors other than Fashion ($9,150), which led all industries in median monthly ad account spend throughout 2022 — except for Ecommerce in Q1 2022.
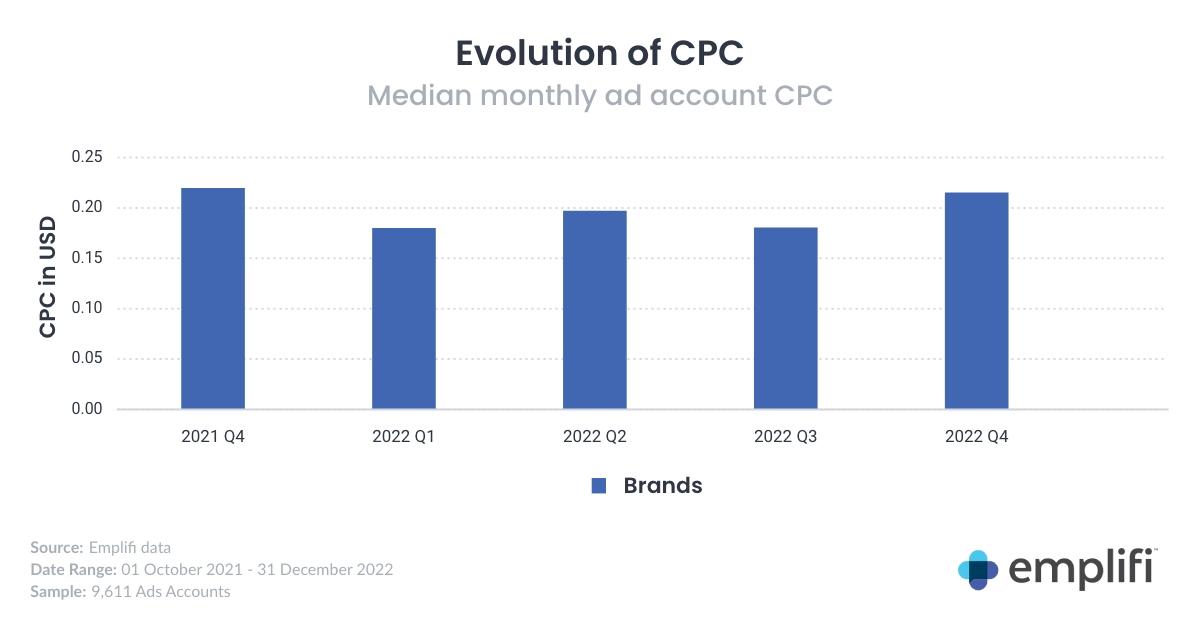
2. Cost-per-click (CPC) — Median Monthly Ad Account (2022 average): $0.19
Key takeaways
Cost-per-click (CPC) for brands mostly fluctuated around the $0.20 mark throughout 2022, before reaching $0.22 in Q4 2022. Although, the Beauty and FMCG sectors saw notable changes during the year.
Of the industries examined, the Retail sector maintained the lowest CPC across the year.
Analysis
Median monthly ad account CPC saw a 19% increase in Q4 2022 to reach $0.22 — its highest level in 2022, and a similar level seen in Q4 2021.
The Fast-Moving Consumer Goods Food (FMCG Food) sector saw a YoY increase of 44%, rising from $0.25 to $0.34. This sector outpaced all others in this regard in Q4 2022, while the Beauty sector — which saw a higher CPC than all other industries in previous quarters — saw the biggest YoY drop, falling 30% from $0.37 to $0.26.
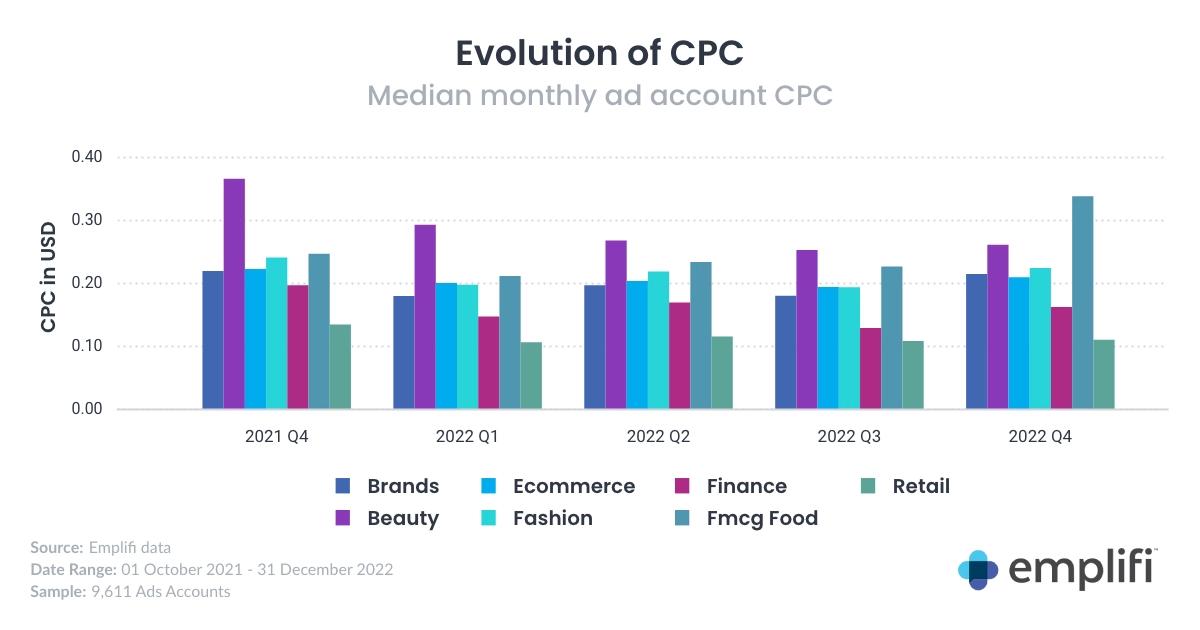
It's worth noting that the CPC for Retail brands is more than 3x lower than that of FMCG Food brands — a gap that was present for several quarters, but that was accentuated in Q4.
3. Click-Through Rate (CTR) — Median Monthly Ad Account (2022 average): 0.94%
Key takeaways
CTR among Brands steadily decreased throughout 2022.
Retail stands out on top of the other industries examined in terms of CTR, seeing an increase YoY.
FMCG Food brands are seeing a notably lower CTR than the other industries examined.
Analysis
The median monthly ad account CTR among Brands has fallen modestly YoY — down 10% from 1.01% to 0.90%. Although, CTR has been steadily decreasing every quarter, even before Q4 2021.
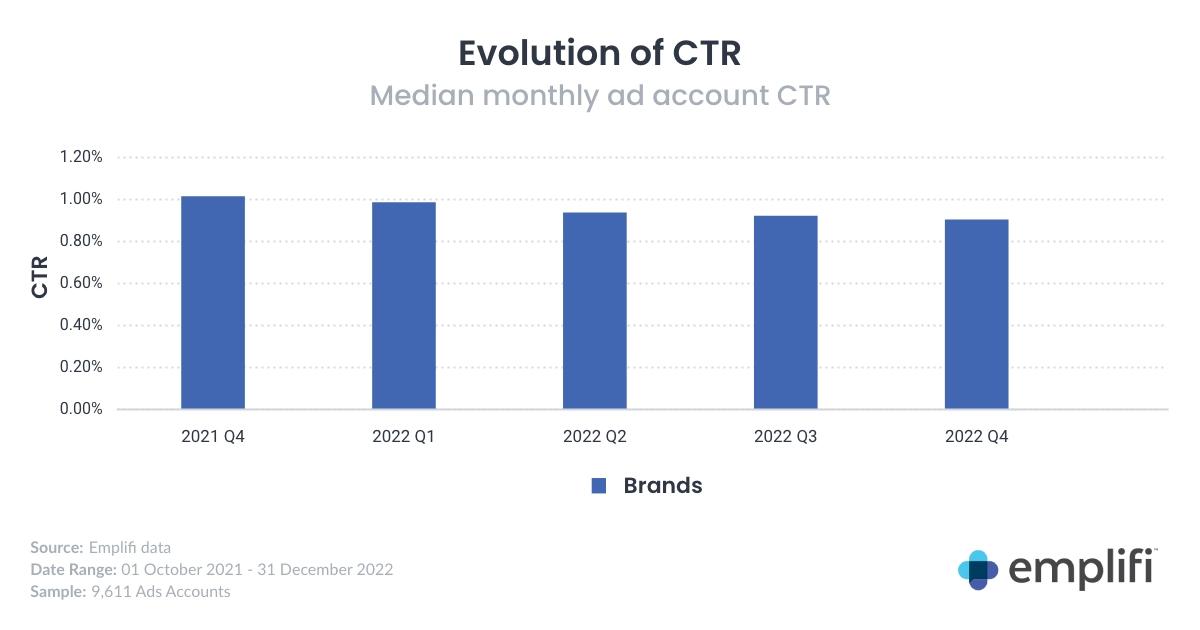
Interestingly, while FMCG Food brands experienced a CPC 3x higher than Retail brands in 2022 (as seen in the previous section), the inverse was seen for their CTR, with Retail brands’ rates reaching a level 5x greater than that of FMCG Food brands in Q4 2022.
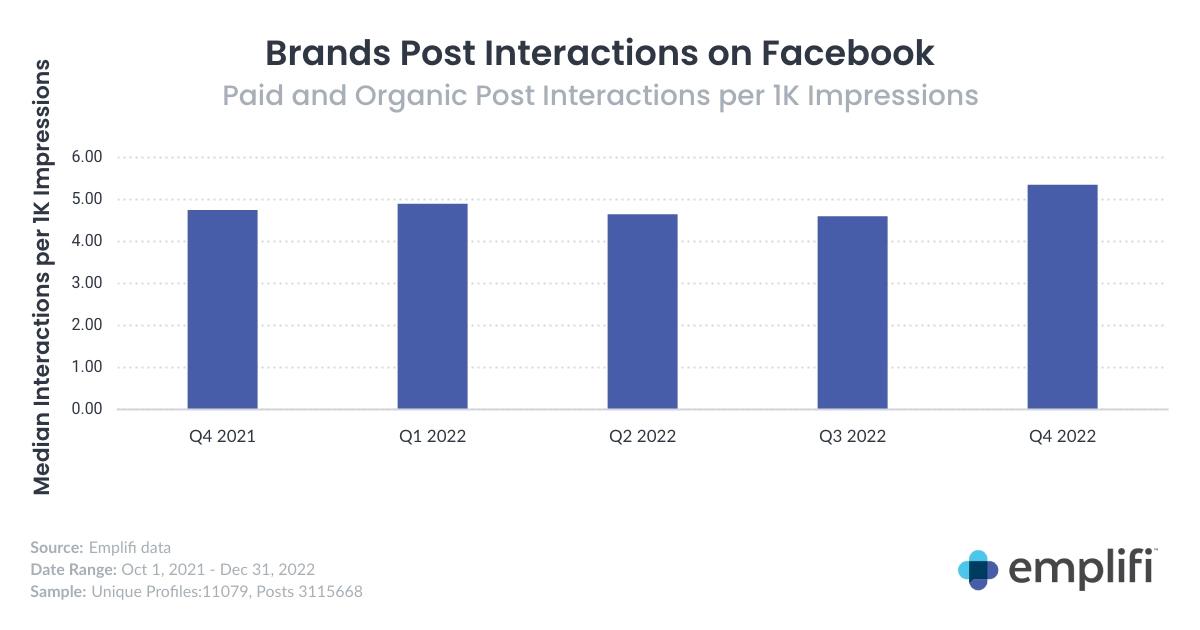
4. Interactions per 1K impressions (2022 averages): Facebook (4.88) vs. Instagram (28.48)
Key takeaways
Brands’ posts on Instagram have consistently — and significantly — generated more engagement than their Facebook posts.
After seeing modest decreases throughout 2022, both Instagram and Facebook saw notable increases in interactions per 1K impressions in Q4 2022.
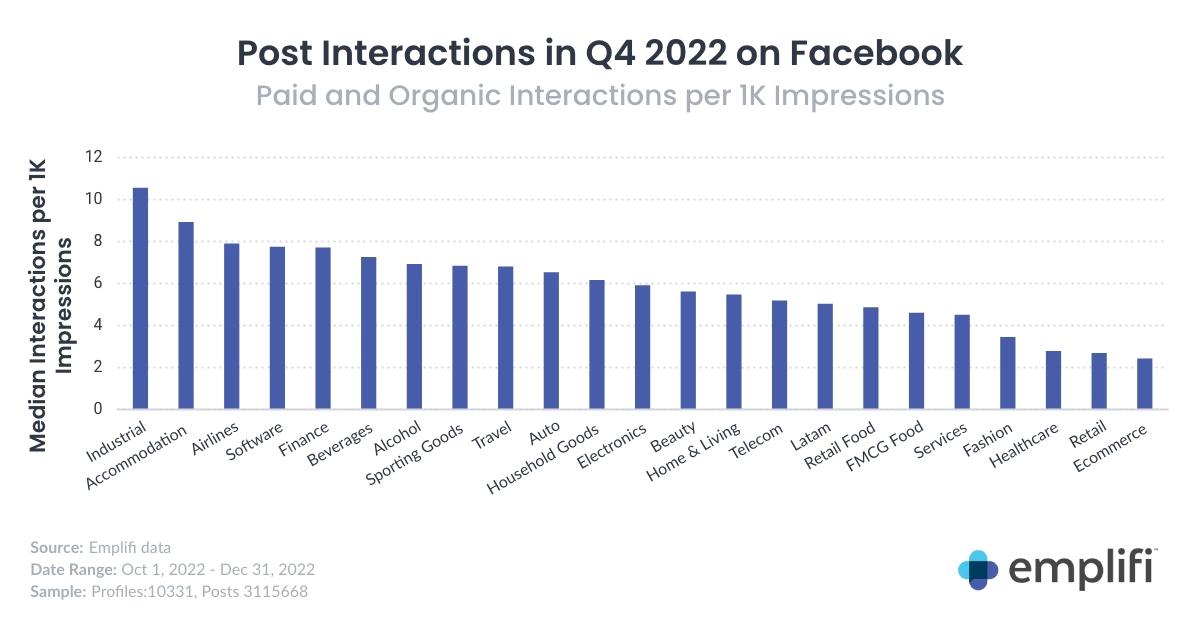
Retail and Ecommerce brands trailed all other industries examined in terms of this metric on both Facebook and Instagram. Interestingly, as both industries ranked 1 and 2 in terms of ad CTR in 2022 (as seen in the previous section), this may be a reflection of the high level of competition that brands face in these industries experience on social media when it comes to organic.
Analysis
Brands' rate of interactions per 1K impressions spiked on both Facebook and Instagram in Q4 2022. Although, the engagement gap between the two remains significant, with Instagram notably outperforming Facebook in this regard.
On Facebook, posts from Brands generated 5.35 interactions per 1K impressions, up 13% YoY and 16% from the previous quarter.
Industrial brands (10.56 interactions per 1K impressions), Accommodation brands (8.93), and Airlines (7.90) outpaced all other industries in this regard on Facebook, while Ecommerce (2.43), Retail (2.69), and Healthcare brands (2.78) trailed.
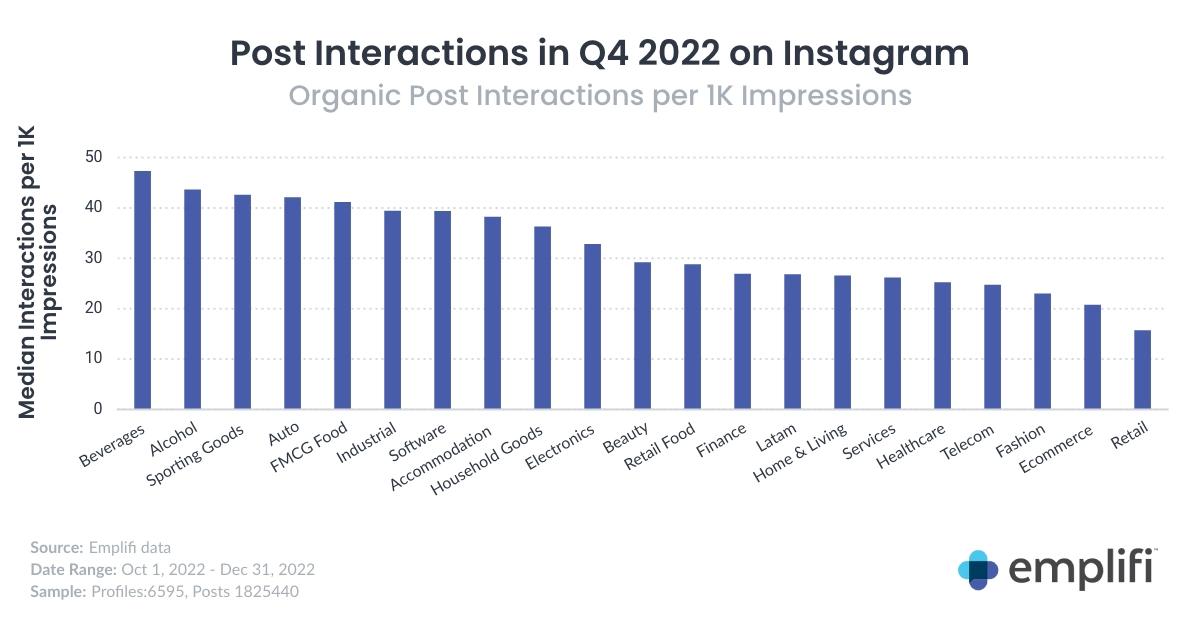
On Instagram, Brands saw their engagement rate increase to 31.16 interactions per 1K impressions in Q4 2022, up 8% YoY and 14% from Q3.
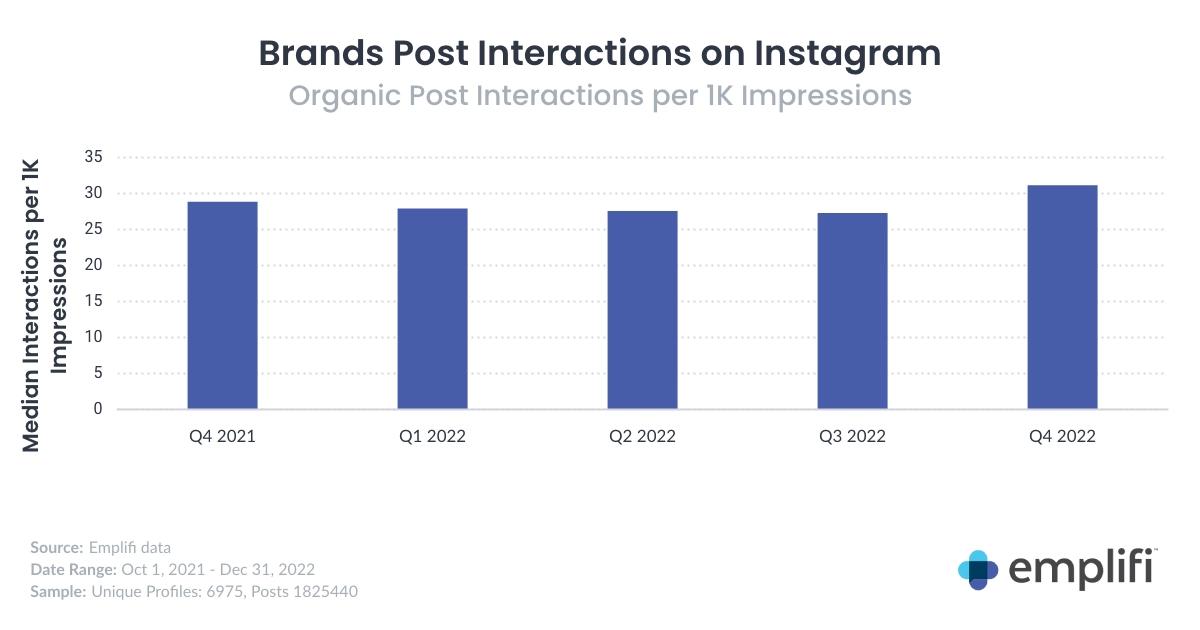
Beverage (47.30 interactions per 1K impressions), Alcohol (43.63), and Sporting Goods (42.59) brands led the way in this regard in Q4 2022. As was seen for Facebook, the number of interactions per 1K impressions for Retail (15.72) and Ecommerce brands’ (20.80) Instagram posts trailed all other industries in Q4 2022, followed by Fashion brands (23.00).
5. When users are most active on Facebook and TikTok
Key takeaway
Facebook users, who are primarily in the 25-34 age demographic, are likely to be most active on the app during working hours.
TikTok user behavior differs between US and European users, which brands must consider for their social media strategies.
Analysis
A couple of notes before we dive in
Only sister Facebook and TikTok profiles are included in this analysis. For example, if Company A has a Facebook account, they are only included in this analysis if they also have an active TikTok account.
This analysis looks at the PST (Pacific Standard Time) and CET (Central European Time) time zones. For example, US brands based in EST (Eastern Standard Time) should adapt their posting times to accommodate the time zone where their audience is primarily located. Please reference the source info provided when reviewing your social media strategy.
This data looks specifically at November-December 2022.
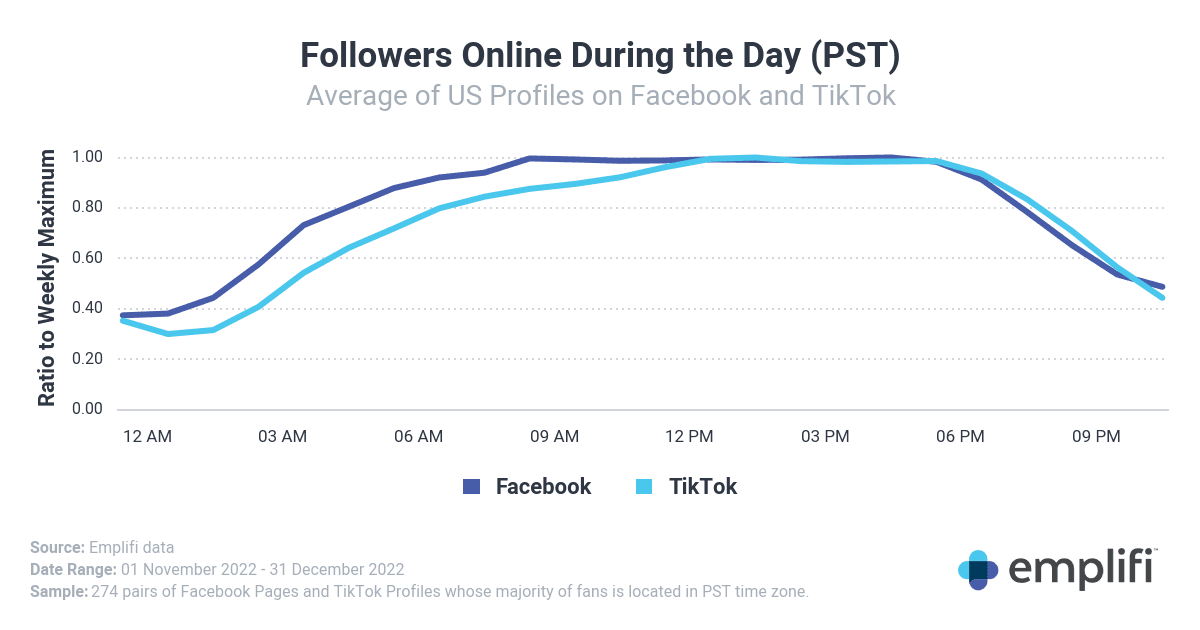
In terms of US users, most U.S. brand follower activity on Facebook tops out at 8 am PST, and remains consistent until 6 pm PST. On the other hand, while a steady stream of TikTok users come online throughout the morning, their activity peaks between 12pm and 6pm PST.
Although, some differences were seen among European users.
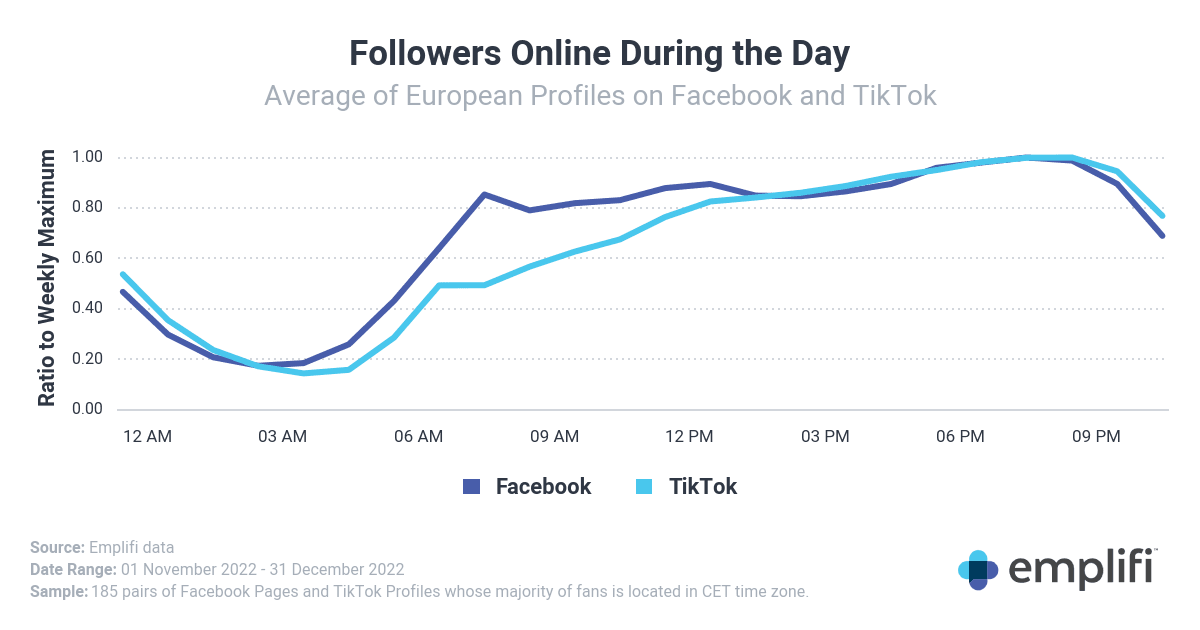
Like US users, European Facebook users start accessing the platform in the morning — primarily at 8am CET — but remain active for longer and drop off around 9pm CET. On the other hand, TikTok follower activity only appears to be increasing over the course of the day, before peaking in the evening between 7pm and 9pm CET.
What do these findings indicate? They could be highlighting how the two platforms are used differently by their audiences. For example, TikTok requires sound, so content cannot be viewed easily while attending school or work. On the other hand, Facebook users, who are primarily in the 25-34 year-old age demographic, are more likely to browse the app while working.
Most importantly, these findings highlight how a one-size-fits-all social media strategy should not be taken. To maximize engagement, brands must be able to adapt their approach to each platform, and cater to their audiences’ behaviors throughout the day.
6. Median response times to social media questions (2022 averages): Facebook (11.8 hours) vs. Instagram (9.3 hours) vs. Twitter (3.0 hours)
Key takeaways
After steadily improving throughout 2022, brands’ response times to questions left in the Comments section of their Facebook posts slightly increased in Q4 2022.
Brands’ response times to questions on their Instagram posts spiked in Q4 2022, reaching a year-high.
Brands continue to answer questions significantly quicker on Twitter than they do to questions left on their Facebook and Instagram posts.
Brands’ response times remain notably longer than what consumers expect from brands, with 52% expecting brands to respond to their questions within one hour.
Analysis
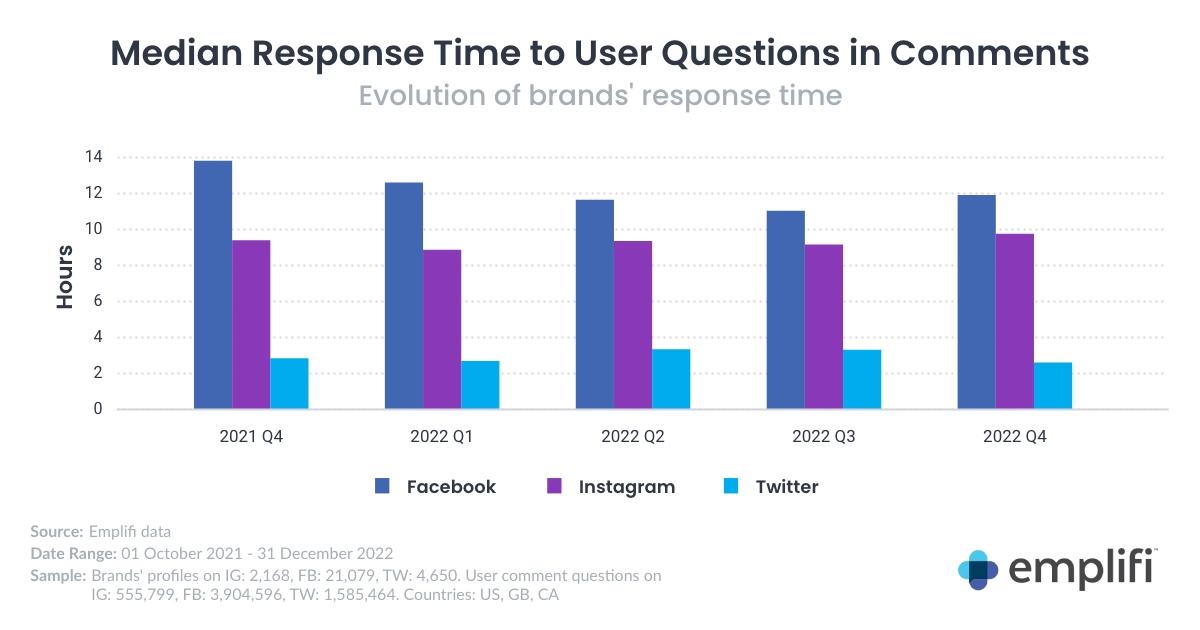
After a steady decline in median response times on Facebook over the past several quarters, it rose 8% (11 hours to 11.9 minutes) in Q4. However, this is still down 14% YoY, showing signs of improvement in this regard.
A similar trend was seen for brands on Instagram, with response times rising to 9.8 hours in Q4 2022. Although, this bump resulted in it being the highest number posted in any quarter this past year.
Twitter remained relatively steady at 2.6 hours, down about 8% YoY.
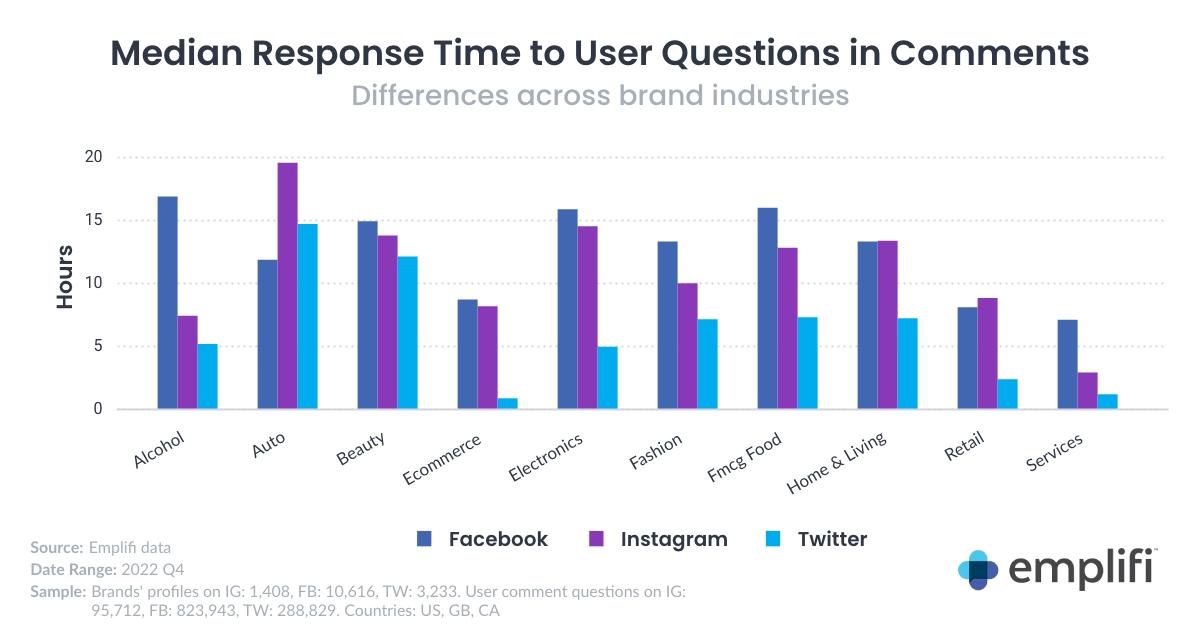
Looking specifically at Q4 2022, while some brands’ response times differed across Facebook, Instagram, and Twitter, Automotive and Beauty brands saw comparatively higher median response times across all three platforms. On the other hand, Services, Retail, and eCommerce brands saw lower median response times than the other industries examined.
Although, it is clear that many brands have room to improve in this regard, as Emplifi research shows that over 50% of consumers today now expect brands to answer their questions within one hour.
Implementing a strong social customer care infrastructure, and even leveraging AI chatbots to help handle some of the more common questions users may have, can prove essential in helping brands improve these metrics — especially during peak times like the holiday season.
Methodology
Our analysis primarily focuses on Q4 2022 data and year-on-year comparisons, downloaded at the beginning of January 2023. The quarterly data presented in this report reflects the state of Emplifi's database starting with the beginning of the previous quarter through the end of the previous quarter for the post. The data is pulled only once and is not updated between releases.
Median monthly ad spend: Calculated as median monthly ad account spend. Per each account, we look at "total spend value," and from all of these ad accounts in one category, we calculate the median value. All values are in USD. The charts displayed in the report show the average monthly median value for a given quarter.
Median monthly ad CPC: Calculated as median monthly ad account CPC. Per each account, we look at "total spend value/total (all) clicks," and from all of these ad accounts in one category, we calculate the median value. All values are in USD. The charts displayed in the report show the average monthly median value for a given quarter.
Median monthly ad CTR: Calculated as median monthly ad account CTR. Per each account, we look at quarterly "total (all) clicks / total impressions," and from all of these ad accounts in one category, we calculate the median value. All values are in USD. The charts displayed in the report show the average monthly median value for a given quarter.
Interactions / 1,000 impressions: Interactions on Facebook are calculated as a sum of all Reactions, Comments, and Shares on posts published by a Page. Interactions on Instagram are calculated as a sum of Likes and Comments on posts published by a profile. For charts displayed in the report, we calculated "Interaction / 1K impressions" for each post in the sample. Then median post value was calculated for each profile in the sample. In the last step, the median was calculated for the industry.
Response rate to user comment questions is based on English questions (2nd level) placed directly under the admin post (1st level). Answers are considered to be admin comments (3rd level) directly replying to the user comment (2nd level). First, the "answers/questions" ratio was calculated for each post, then the average was calculated for each profile. As the last step, the average is calculated for all profiles in the benchmark (industry).
Response time to user comment questions is based on English questions (2nd level) placed directly under the admin post (1st level). Answers are considered to be admin comments (3rd level) directly replying to the user comment (2nd level). Only answered comments are taken into account. First, the median response time was calculated for each post, then again median was calculated for each profile. As the last step, the median was calculated for all profiles in the benchmark (industry).
Additional terms relating to our TikTok vs. Instagram analysis:
Sister TikTok and Instagram Profiles: Profiles owned by the same Emplifi client on both Instagram and Tiktok that have the same handle (e.g., www.instagram.com/examplecompany and www.tiktok.com/@examplecompany.)
TikTok Engagements: Defined as the sum of Likes, comments, and shares.
Reach Engagement Rate: Defined as the sum of Engagements for a post, divided by total Reach for that post. For more information on the definition of these metrics, check out this resource (note: Socialbakers is now Emplifi).