If your brand account randomly posts on X (Twitter) without assessing analytics, it costs you. Every untracked post represents missed opportunities to understand what resonates with your audience and drives real business results – on a platform where millions of potential customers spend over 30 minutes daily.
To stop wasting your time and resources, use analytics to understand exactly what’s working and what’s failing in your brand’s content efforts on the platform. These analytics give you the data you need to revamp your social media strategy and maximize ROI – to the tune of a 30% increase in customer engagement and a 47% increase in followers.
This guide will walk you through how to use X analytics, which metrics to track, and how you can leverage them to improve your brand’s strategy on the platform.
What are X (Twitter) analytics?
X (Twitter) analytics provide essential data to measure your brand’s effectiveness on the platform. On the native analytics dashboard, you can see how your brand’s posts are performing and how your account is doing overall. It tracks impressions, engagement rate, profile visits, new followers, and other social media metrics for your account.
Pay close attention to these metrics, and adjust your strategy based on your learnings if you want your account to not only grow but reach its target audience and make an impact.
How have X (Twitter) analytics changed over time?
One of the biggest changes to X (Twitter) since its rebrand is that only Premium users can access analytics. There are two tiers of Premium membership available for companies: $2,000 annually for Basic, and $10,000 for Pro.
Another change: The platform now offers more sophisticated real-time monitoring and sentiment analysis while providing less regular public disclosure about user metrics.
Overall, social media marketers can still access robust, integral data that shows what’s resonating with their audience on X, allowing you to better target your ideal customers and evaluate your content performance.
How do you access X (Twitter) analytics on desktop and mobile?
In order to take advantage of analytics on X (Twitter), you’ll need to understand the basics of how to access it for your brand. Here’s a quick cheat sheet to make sure you and your team get in easily:
How to access X analytics on desktop
- Go to the Home screen. On the left-hand menu, click on Premium. Then, select analytics from the quick access menu.
- You’ll see a dashboard with options to view metrics from the past 7 days, 28 days, 3 months, or 1 year.
- Use the left-side menu under account overview to toggle between different metrics, like impressions and replies, using line graphs. Use the drop-down menu on the right to show the results in a bar graph format.
- Find metrics for individual posts on the content tab.
How to view X analytics on mobile
Users without Premium accounts can get analytics on individual tweets through the X (Twitter) mobile app. More holistic data is not available on mobile.
- Tap the post you want to analyze.
- Select the graph icon on the bottom right of the post to see impressions, engagements, new followers, and profile visits.
Which X (Twitter) metrics should I track for my brand?
Below is a breakdown of the most important metrics that are native in X (Twitter) analytics and via third-party analytics tools to track where your brand’s posts are hitting and missing.
Impressions
X impressions are the number of times your tweet has been viewed across the platform, including retweets. Impressions essentially count eyeballs and give you an idea of how many people you’re potentially reaching. It’s a crucial metric for brand awareness.
Remember:
- The total number of users you’ve reached is likely lower than the total impressions since some users will see a tweet more than once.
- Impressions don’t count views of your tweet when it has been screenshot or embedded on other platforms, such as LinkedIn.
Likes, mentions, and retweets
These metrics show what your audience is responding to from your content. Use an integrated AI-powered social media marketing platform to help track these, especially mentions, so that you can easily and quickly identify when users are talking about your brand and respond right away – including with a built-in AI composer or another automated tool.
Engagement rate
Engagement rate is calculated by dividing the number of actions taken on your tweets or account by the number of impressions. So, if you have 1,000 impressions and 20 likes, replies, link clicks, new followers, and mentions, that’s a 2% engagement rate.
Profile visits and link clicks
Profile visits and CTA clicks help validate the overall impact of your X brand account. For example, if you have a post with a high number of impressions but a low engagement rate and corresponding profile visits, that can tell you that you’re reaching an audience, but you’re not reaching your target audience. Conversely, a post with lower impressions but higher numbers of link clicks and profile visits can be more valuable than other posts with further reach.
Follower growth
To get a better understanding of how your brand’s audience is developing over time, look at follower growth. Follower growth shows how your X (Twitter) following has increased (or decreased) over time, and how many new followers you’ve acquired. Notice unusual spikes or anomalies? Revisit your activity on those days to determine the cause.
Results, conversions, and CPR
These are the X (Twitter) metrics that will help you understand your paid efforts. The results metric indicates how many users take actions that align with your campaign objectives. It’s an essential way to determine whether an ad is delivering on your objective.
Setting the right objective is the cornerstone for measuring your cost per result (CPR). It’s an average of how much you pay for each action a user takes after seeing an ad. If that particular action isn’t taken, you won’t be charged.
Finally, conversions show how many people perform a desired action outside the X (Twitter) sphere after viewing and engaging with your ad. Use conversions to measure which campaigns drive actions such as site visits, sign-ups, and purchases.
How do I know if X (Twitter) is right for my brand today?
In 2024, brand activity declined on X (Twitter), as the platform saw decreases in active profiles, ad spending, and overall engagement. The number of active brand profiles shrank across all regions, with the steepest declines in North America and Europe. Many major brands significantly reduced activity, including ad spend.
While X (Twitter)’s declining activity may concern you and your team, the platform may be right for you for targeting highly specific audiences or leveraging its trending content format. If your audience is on the platform, charge ahead. Check out Emplifi’s social media benchmarks report to learn more about how to evaluate X (Twitter) for your brand.
How can you turn X (Twitter) analytics into actionable marketing insights?
Your X (Twitter) analytics can be a goldmine of data, but how do you translate that into helpful information for your overall marketing strategy?
- Evaluate individual post performance and your profiles’ aggregated performance over time. Individual tweets might soar or tank, but if the general trend is upward, you can stick to your strategy and tweak the messaging. Conversely, if you have a few viral tweets but you’re not seeing follower growth and profile visits increase, it’s time to rethink your entire approach.
- Choose the right third-party social media analytics tool. A platform with a unified dashboard will outperform X (Twitter)’s native any day. Why? A consolidated dashboard with all of your cross-platform data allows you to derive larger insights and drives productivity by as much as 40%. X (Twitter)’s native analytics only allows you to analyze one profile at a time, which prevents companies from getting clarity on the bigger picture. Large corporations with several product divisions or brands with a presence in different regional markets may want to target users with several different X (Twitter) accounts. Consumer brands like Nike and Spotify have specific handles for their social media customer service, for example, and users know to tag those handles for inquiries. These strategies can go a long way – but only if you can analyze them holistically. In Emplifi’s AI-powered social media marketing platform, users can group all of their profiles and track overall X (Twitter) performance across all their profiles.
- Identify top-performing content and replicate success: When building an X (Twitter) strategy, you want to pinpoint your best-performing tweets and identify success patterns. Looking at impressions, engagement, and interactions, you can learn what type of content lands particularly well with your followers and create future content based on this knowledge. The best content isn’t always obvious at the start of a campaign. Be sure that you’re testing and learning what your audience cares about.
- Find the best time to post: As a platform that focuses on short, real-time information sharing, it’s crucial to identify the right times to post on X (Twitter). While you might be located in one part of the world, your followers are likely to be global, so the best posting time might not be that obvious. While X (Twitter) native analytics shows engagement rates on specific days, it doesn’t have breakdowns per hour or day. In the Emplifi platform, you can see user activity by day of the week and even hour of the day.
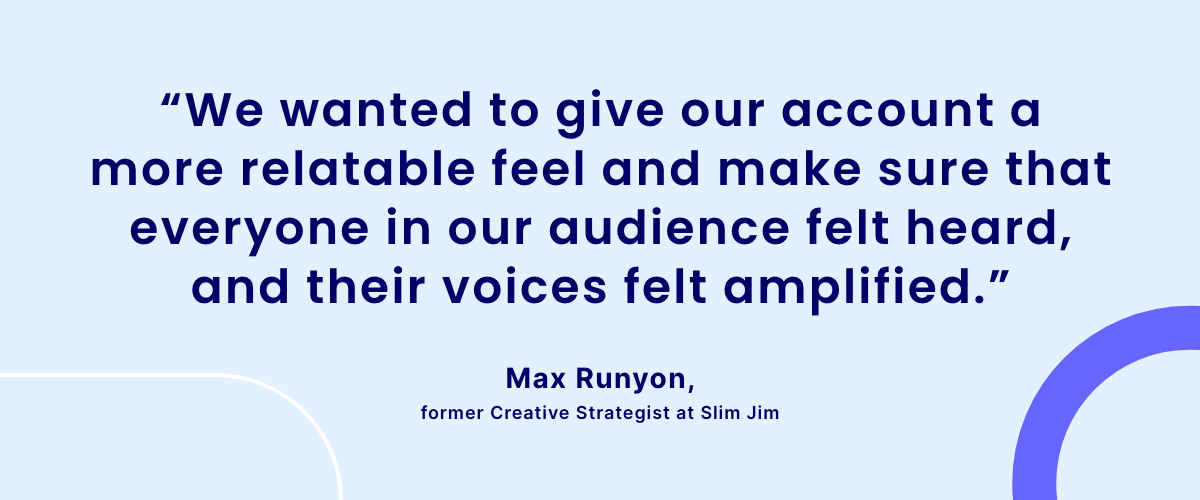
- Tailor content to your audience: X (Twitter) ads manager helps organizations get a clearer picture of who their followers are, understanding age, gender, location, household income, and even buying styles. Alongside information about their top interests, these insights can help you craft tweets that speak directly to your ideal customer. However, creating content your audience cares about requires more than just demographic info. Max Runyon, former Creative Strategist at Slim Jim, took the brand’s X/Twitter account from dormant to viral by listening to the audience and creating opportunities for genuine moments.
- Identify and vet influencers and brand ambassadors: With the top follower metric, you can track people in your network with the biggest potential audience. Follow back and engage with them to strengthen ties and keep the relationship alive for future brand advocacy, UGC, and influencer marketing campaigns. With the right influencer marketing tool, getting into the right conversations with the right people is straightforward. Let the platform do the heavy lifting to view all incoming content, and to vet and compare influencer performance with ease.
- Create reports to share the ROI: To check back on your data and compare performance over time, don’t forget to export it regularly. Exports are great for providing management with clear and precise performance reports and for sharing knowledge with colleagues. With a simple exporting function, monthly reports are right at your fingertips. If you’re reporting on a quarterly or weekly basis, third-party providers like Emplifi are ideal, allowing you to adjust time frames more flexibly and even schedule reports to your email inbox automatically.
- Analyze the competition to stay ahead of the game: Followers never see your tweets in isolation. They appear right next to those of other brands, including your competitors. Analyzing your competitors’ X (Twitter) accounts helps refine your own: learn from their gaps, get inspired, and create a strategy that’s unique to your brand. Competitive benchmarking is currently unavailable in X (Twitter)’s native analytics but can be pulled with Emplifi, where you can compare yourself against a competitor, or even against the whole industry.
- Measure your X (Twitter) performance in the context of your overall social media strategy: Consider your X (Twitter) analytics in a broader social context to understand the bigger picture. By comparing results across all social media platforms, you can identify gaps and find opportunities to maximize the impact of individual platforms. Tying X (Twitter) to the wider social ecosystem creates a more consistent experience for your followers, and it improves decision-making for the X (Twitter) strategy itself. While analyzing X (Twitter) next to other social media platforms can’t be done in the native X (Twitter) analytics, you can easily analyze cross-platform analytics in Emplifi.
Final thoughts on X (Twitter) analytics
The difference between brands that struggle on X and those that dominate? Data-driven decisions.
Don’t just post content – measure, analyze, and optimize it to capture attention in an increasingly crowded digital landscape. To take it up a notch, assess your X (Twitter) analytics in a unified, simple tool like Emplifi’s AI-powered social media marketing platform.