Here are the latest enhancements, advancements and small-but-helpful refinements in the recent releases:
Comparison Overview improvements across Paid Analytics and Content Hub
Support for Long Twitter Videos
Listening Results By the Hour
5 More Metrics to Track in Ad Feed
Social Platform View improvements between Paid Analytics and Content Hub
Video Publishing on personal LinkedIn Profiles
Filtering for Instagram Mentions in Community
Bulk actions applicable to unlimited Community Content
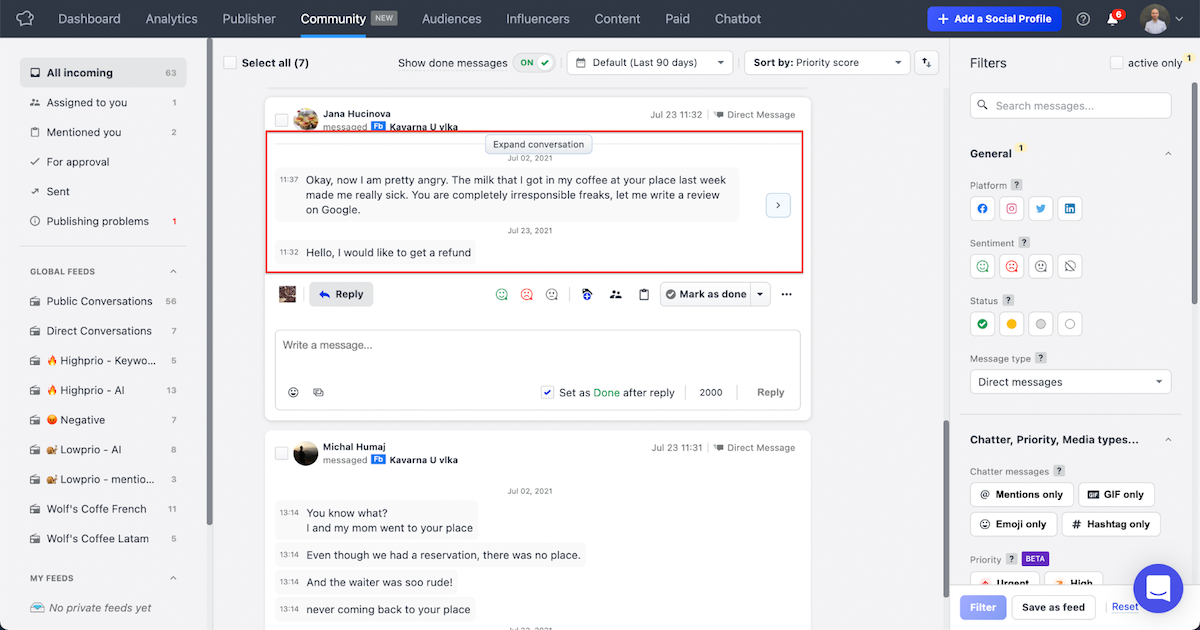
Expand DM conversations in the Inbox Feed for greater context
Let’s dive into the details!
See, Understand and Dig Deeper
Comparison Overview improvements across Paid Analytics and Content Hub
Comparison overview has received a makeover and now it is possible to jump directly from its charts to the visuals in Content Hub. This way all users can learn immediately what ads shaped their overall results the most even when they start from campaigns or ad accounts first.
With this new feature you will be able to scan your charts for quick insights across key metrics while zeroing in on the significant examples that shaped your overall results. How? Just check the chart you prefer, be it a line chart or a bar chart, and then click right on it to see the underlying ads.
When you click on a data point in the line chart or on the bar in the bar chart, you are taken directly to the all-place-content - the Content Hub. There you can see which ads are behind your results, pre-filtered and pre-sorted for you!
How is that filtered and sorted? Easy. The filters you use in Paid Analytics search bar are used to filter your ads to only show relevant content. Time range is also copied (for line charts it is adjusted by selected aggregation). Finally, the ads come sorted by the metric you were inspecting before in the chart.
Where and How?
So just head to Paid Analytics, select your source (ad account/s or campaigns), add platform and campaign objective filters, desired time range and aggregation and off you go! Now you want to see the underlying ads? Just click on a chart. Finished with detailed content digging? Click the top-level analysis button and you’ll be taken right back to the bird’s eye view in the Paid Analytics tab.
Upload of Long Twitter Videos
New to the release is the ability to have whitelisted Twitter profiles schedule and publish videos up to 10 minutes long.
For normal profiles, Twitter only allows the scheduling of videos up to 140s in length, both via native platform and via API. Publishers and media outlets often need to publish videos that are longer. Twitter provides the ability to whitelist the account and upload videos up to 10 minutes long.
Listening Results aggregated by Hour
Precision Insights with Timely Granularity
Social media is dynamic, and the best brands obsess about data and details - even at an hourly basis in order to spot trends or keep a pulse on possible crises. Social Marketing Cloud’s listening tools are refreshed to help you analyze the number of mentions, authors or topics across time dips and spikes, with a complete breakdown by the hour with all the details needed to optimize outcomes.
Any chart that is broken down by time can now be viewed with an hour-to-hour granularity. Just select “hour” in the “Aggregated by” picker in the top ribbon to see your charts dissected to that level of detail. No matter what view is selected be it the aggregated overview, volume, key topics or yet another metric, and apply this breakdown to any chart with time on the x-axis.
Clicking in these charts directs to the Content Hub where additional analytics such as the actual mentions (posts, tweets, etc.) from queries are presented, all pre-filtered for the exact time that was clicked on in the line chart in Analytics and for the rest of parameters in the search bar.
Note:
Default aggregation depends on the selected time range. The aggregation by hour is on by default for a time range of seven days or less and can only be applied to this time range.
5 More Metrics in Ad Card Metrics Bar
Data and metrics are essentials in the world of social media. Quantifying and analyzing results now and on a routine basis helps to deliver improved results in the future. Check out five newly added and highly requested metrics in the Ad feed in Content Hub to analyze ads with even more details to help deliver detailed insights.
In addition to impressions, spend, clicks, interaction count, video plays, CTR, CPC, CPM, frequency and reach, there are now these additional metrics to analyze:
cost per post engagement
post engagement
link clicks
leads
landing page views
The analytics are directly on the ad card. Just open Content Hub, go to Ads and just plug in the ad accounts or campaigns and cross-compare those metrics to get the insights desired. Once the analysis is complete, an export can be sent to colleagues or scheduled as an automated report to share results at a regular cadence.
Additional Click-Throughs Between Paid Analytics and Content Hub - Social Platform View
The platform view has evolved to now support the ability to jump directly from its charts to the visuals in Content Hub. This way all users can learn immediately what ads shaped their overall results the most, even when the user starts from campaigns or ad accounts first.With this new feature, charts can be scanned for quick insights across key metrics while zeroing in on the significant examples that shaped the overall results. It’s as easy as checking the chart, then click right on it to see the underlying ads.
When the bar in the bar chart is clicked, the Content Hub surfaces where all the ads are pre-filtered, pre-sorted and organized against the results. The filters utilized in the Paid Analytics search bar are used to filter the ads to only show relevant content. Time range is also copied. Finally, the ads come sorted by the metric chosen before in the chart.
To try this out, go to Paid Analytics, select a source (ad account/s or campaigns), add platform and campaign objective filters, desired time range and the results display. To see the underlying ads, just click on a chart. Click the top-level analysis button to return to the top level in the Paid Analytics tab.
Video publishing on personal LinkedIn profiles
Schedule and publish video content on LinkedIn on behalf of your CEO, marketing leader or any other person in your company. Scheduling for personal LinkedIn profiles has been around for some time, but with this release we are adding an option to schedule videos!
Filtering for Instagram Story Mentions in Community
Filter out Instagram Story Mentions in Community and focus on what’s important first. We understand that responding to the questions and complaints of your customers on Instagram has really high priority. Much higher than reacting to their Instagram Stories where they tagged your brand - or you may not even want to react to these at all. For this reason, we are now introducing a filter in Community that allows you to filter in or out these Story mentions.
Bulk actions for unlimited number of Community Content (in Community Inbox)
Apply labels, sentiment or mark as done in bulk all the messages that match your criteria. Previously you had to scroll through all the messages before you were able to select all of them. With this update, you are now no longer limited. You can apply labels, sentiment or status on as many messages as you want, and you don’t need to scroll through them anymore!
Expanded Direct Messages conversation in Inbox's Feed for better context
Respond to the direct message conversations with less clicks, without a need to open the conversation detail. Previously, to get the full context of the conversation, you had to open the detail section. With this enhancement, we are giving you more context by showing multiple messages from the social media user plus you can expand the conversation directly in the Inbox’s Feed.
Editor's Note: This article was originally published on socialbakers.com. Any statistics or statements included in this article were current at the time of original publication.

